Math 11008 Homework 5 Worksheet - Kent State University, Spring 2014 Page 2
ADVERTISEMENT
 1
1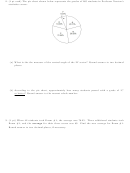 2
2 3
3 4
4 5
52. (1 pt each) The pie chart shown below represents the grades of 265 students in Professor Newton’s
statistics course.
(a) What is the the measure of the central angle of the ‘B’ sector? Round answer to two decimal
places.
(b) According to the pie chart, approximately how many students passed with a grade of ‘C’
or better? Round answer to the nearest whole number.
3. (1 pt) When 42 students took Exam #1, the average was 76.25. Three additional students took
Exam #1, and the average for their three scores was 83. Find the new average for Exam #1.
Round answer to two decimal places, if necessary.
ADVERTISEMENT
0 votes
Related Articles
Related forms


Related Categories
Parent category: Education