Take Home Test 2 Sta 2023 Worksheet
ADVERTISEMENT
 1
1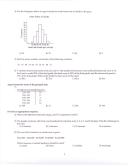 2
2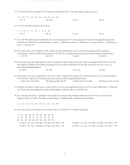 3
3 4
4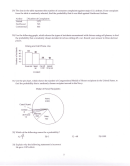 5
5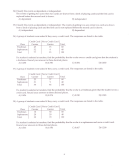 6
6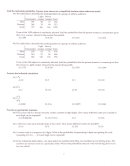 7
7 8
8Take Home Test
2
STA 2023
DUE
_
Nmne
_
Provide an appropriate
response.
1) The heights (in inches) of 30 adult males are listed below. Construct a dot plot for the data.
70
72
71
70
69
73
69
68
70 71
~
71
ro n
@ ~
71
71
71 72
@
71
~
~
~
n ro
71
@ ~
2) A study was conducted to determine how people get
jobs.
Four hundred subjects were randomly selected and
the results are listed below.
Job Sources of
Survey Respondents
Frequency
Newspaper want ads
Online services
Executive search firms
Mailings
Networking
69
124
72
32
103
Construct a pie chart of the
data.
3) A safety engineer wishes to use the following data to show the number of deaths from the collision of passenger
cars with trucks on a particular
highway.
Use a time series chart to display the
data.
Describe any trends shown.
Year
Number of Deaths
1930
12
1940
17
1950
22
1960
21
1970
16
1980
13
1990
11
2000
12
1
ADVERTISEMENT
0 votes
Related Articles
Related forms


 Ap Calculus Take-home Packet 5 Optimization Math Worksheet")


Related Categories
Parent category: Education