Math Ii Exam Worksheet - Boulton Stats Review Page 7
ADVERTISEMENT
 1
1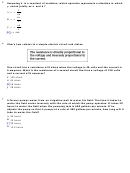 2
2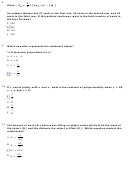 3
3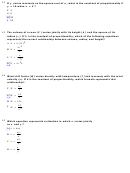 4
4 5
5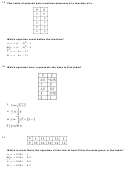 6
6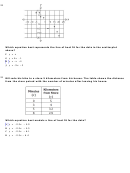 7
7 8
8 9
9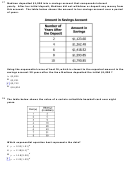 10
10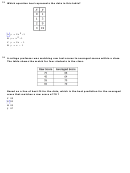 11
1122
Which equation best represents the line of best fit for the data in the scatterplot
above?
F y = x
G y =4 x -1
H y =- x +4
J y =-9 x +3
23 Bill rode his bike to a store 5 kilometers from his house. The table shows the distance
from the store paired with the number of minutes after leaving his house.
Which equation best models a line of best fit for the data?
A y = -0.3 x + 4.9
B y = -0.2 x + 4.5
C y = -0.2 x + 6.1
D y = -0.3 x + 6.4
ADVERTISEMENT
0 votes
Related Articles
Related forms


Related Categories
Parent category: Education