Percentage Worksheet With Answers Page 4
ADVERTISEMENT
 1
1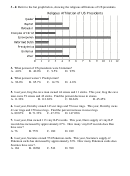 2
2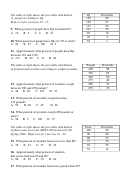 3
3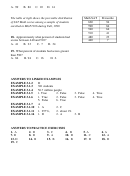 4
4A. 99
B. 86
C. 10
D. 14
The table at right shows the percentile distribution
Math SAT
Percentile
of SAT Math scores among a sample of students
660
94
enrolled in MGF1106 during Fall, 1999.
590
84
540
64
510
41
18. Approximately what percent of students had
480
23
scores between 440 and 510?
440
7
A. 41
B. 23
C. 7
D. 34
19. What percent of students had scores greater
than 590?
A. 84
B. 94
C. 16
D. 6
ANSWERS TO LINKED EXAMPLES
EXAMPLE 3.1.2
D
EXAMPLE 3.1.3
381 students
EXAMPLE 3.1.4
56.7 million people
EXAMPLE 3.1.5
1. True
2. False
3. False
4. True
EXAMPLE 3.1.6
1. True
2. False
3. False
4. True
5. False
6. True
EXAMPLE 3.1.7
A
EXAMPLE 3.1.10
1. A
2. C
EXAMPLE 3.1.11
1. 257%,
2. about 1%
EXAMPLE 3.1.14
1. D
2. A
3. B
ANSWERS TO PRACTICE EXERCISES
1. A
2. D
3. C
4. B
5. A
6. A
7. D
8. D
9. A
10. D
11. C
12. A
13. D
14. B
15. B
16. B
17. D
18. D
19. C
ADVERTISEMENT
0 votes
Related Articles
Related forms


Related Categories
Parent category: Education