Graphing Quadratic Functions In Vertex Form Worksheet - Mat 190, Test 4 Page 2
ADVERTISEMENT
 1
1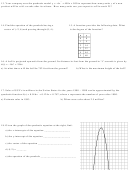 2
22
13. Your company uses the quadratic model y = –6x
+ 450x + 500 to represent how many units y of a new
product will be sold x weeks after its release. How many units can you expect to sell in week 25?
14. Find the equation of the parabola having a
15. A function provides the following data. What
vertex of (–2, 6) and passing through (0, 4).
is the degree of the function?
x
y
0
0
1
5
2
14
3
27
4
44
5
65
16. A ball is projected upwards from the ground. Its distance in feet from the ground in “t” seconds is given by
2
d(t) = –16t
+ 256t.
a) At what times will the ball be 752 feet from the ground?
b) What is the maximum height of the ball?
17. Sales of SUVs in millions in the Unites States for the years 1990 – 1999 can be approximated by the
2
quadratic function f(x) = 0.016x
+ 0.124x + 0.787, where x represents the number of years after 1990.
a) Estimate sales in 1993.
b) When were sales about 2.5 million?
18. Given the graph of the quadratic equation at the right, find:
a) the x-intercepts of the equation __________________
b) the y-intercept of the equation ___________________
c) the vertex of the equation ________________________
d) f(-2) = _______
e) the equation of the parabola _________________________
ADVERTISEMENT
0 votes
Related Articles
Related forms


Related Categories
Parent category: Education