Graphing Quadratic Functions Worksheet Page 3
ADVERTISEMENT
 1
1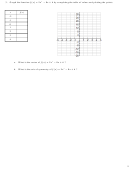 2
2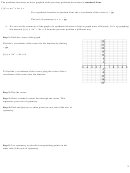 3
3 4
4 5
5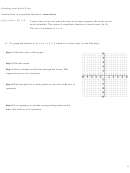 6
6 7
7 8
8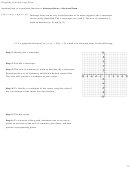 9
9 10
10 11
11The quadratic functions we have graphed in the previous problems have been in standard form:
( )
��
For a quadratic function in standard form, the x-coordinate of the vertex is
.
��
��
The axis of symmetry is ��
.
��
4. We can use the symmetry of the graph of a quadratic function to help us graph more efficiently. Let’s try graphing
the function ( )
from the previous problem a different way.
Step 1: Find the vertex of the graph.
Find the x coordinate of the vertex for the function by finding
��
.
��
�� ( �� )
��
��
.
To find the y-coordinate of the vertex, plug the value of the x-
coordinate of the vertex into the function.
Step 2: Plot the vertex.
Step 3: Draw a dashed vertical line through the vertex. This
represents your axis of symmetry.
Step 4: Find and plot two or three points on one side of the axis of
symmetry.
Step 5: Use symmetry to plot the corresponding points on the
other side of the axis of symmetry.
3
ADVERTISEMENT
0 votes
Related Articles
Related forms


")


Related Categories
Parent category: Education