Cbse Open Text Material And Cbse Sample Questions Including Some Probable Questions Theme Wise Math Worksheet - Class-Ix, 2014-15 Page 10
ADVERTISEMENT
 1
1 2
2 3
3 4
4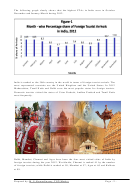 5
5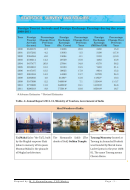 6
6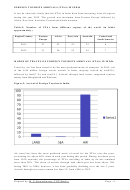 7
7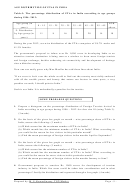 8
8 9
9 10
10 11
11 12
12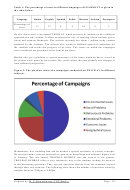 13
13 14
14 15
15 16
16 17
17(ii) Africa
(iii) East Asia
(iv) Australia
(v) Central and South America
(vi) neither from Africa not from Australia
(vii) neither from East Asia nor from Eastern Europe.
24. The table 3 shows the percentage distribution of FTAs in India according to the age-
groups during 1996-2012. One of the foreign tourist is selected at random.
Find the probability that his/her age is
(i) less than 15 years
(ii) 15 years or more but less than 25 years.
(iii) 25 years or more but less than 35 years.
(iv) 35 years or more but less than 45 years.
(v) 45 years or more.
(vi) 45 years or more but less than 55 years.
(vii) 55 years or more but less than 65 years.
(viii) 15 years or more but less than 45 years.
(ix) 25 years or more but less than 65 years.
(x) 45 years or more but less than 65 years.
(xi) 15 years or more.
(xii) 25 years or more.
25. A Foreign Tourist is selected at random (see Figure 2.). Find the probability that the
Foreign Tourist selected at random arrived in India through the modes of travel by
(i) Land
(ii) Sea
(iii) Air
26. If FTA is selected at random from the Table 2. for the year 2012, find the
probability that the Foreign Tourist selected at random arrived from
(i) Eastern Europe
(ii) Africa
(iii) East Asia
(iv) Australia
(v) Central and South America
(vi) neither from Africa not from Australia
(vii) neither from East Asia nor from Eastern Europe.
27. Draw a double bar graph for number of FTAs from different regions of the world
for the years 2011 and 2012 using Table 2.
Prepared by: M. S. KumarSwamy, TGT(Maths)
Page - 7 -
ADVERTISEMENT
0 votes
Related Articles
Related forms


 Class Xii (2014-15) Worksheet")
 Math Worksheet")


Related Categories
Parent category: Education