Lesson 9 Make A Graph Worksheet - Unit 3 - Using Algebra Page 2
ADVERTISEMENT
 1
1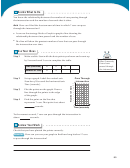 2
2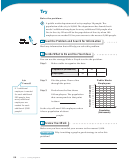 3
3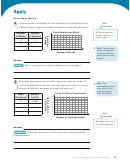 4
4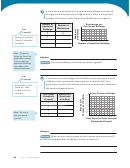 5
5 6
6Decide What to Do
You know the relationship between the number of cars passing through
the intersection and the number of seconds that it takes.
Ask How can I nd the least amount of time in which 7 cars can pass
through the intersection?
I can use the strategy Make a Graph to graph a line showing the
relationship between time passed and the number of cars.
e line will show the greatest number of cars that can pass through
the intersection over time.
Use Your Ideas
Step 1
Make a table. Start with the data points you know and count up
by 2 seconds and 3 cars to complete the table.
After 0 seconds,
0 cars have
passed through
Time (seconds)
0
2
4
the intersection.
Number of Cars
0
3
Step 2
Set up a graph. Label the vertical axis
Cars Through
Intersection
Number of Cars and the horizontal axis
11
Time (seconds).
10
9
Step 3
Plot the points on the graph. Draw a
8
7
line through the points to the edge
6
5
of the graph.
4
3
Step 4
Find the point on the line that
2
1
represents 7 cars.
at point is at about
0
1
2
3
4
5
6 7
seconds.
Time (seconds)
To the nearest second, 7 cars can pass through the intersection in
about
seconds.
Review Your Work
Check that you have plotted the points correctly.
Describe
How can you use your graph to nd how long it takes 17 cars
to pass through the intersection?
85
ADVERTISEMENT
0 votes
Related Articles
Related forms


 Velocity Time Graphs Worksheet")


Related Categories
Parent category: Education