Favorite Girl Scout Cookie Tally Bar Graph Template Page 2
ADVERTISEMENT
 1
1 2
2 3
3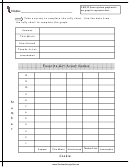 4
4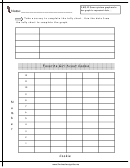 5
52.MD.10 Draw a picture graph and a
Name:________________________
bar graph to represent data…..
Use the graph to answer the following questions.
1. Which cookie received the most number of votes?
_________________________
2. Which cookie received the least number of votes?
_________________________
3. Did any cookies get the same number of votes? If so, which ones?
__________________________
_____________
4. How many people voted for Shortbread?
____________
5. How many people voted for Thin Mints?
_____________
6. How many people voted altogether?
7. How many more votes did ____________ receive than
_____________ ?
(NUMBER SENTENCE)____________________________________________
ADVERTISEMENT
0 votes
Related Articles
Related forms


Related Categories
Parent category: Business