Mind On Statistics - Chapter 13 Worksheets With Answers Page 19
ADVERTISEMENT
 1
1 2
2 3
3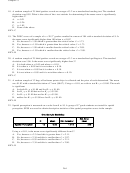 4
4 5
5 6
6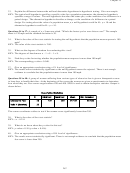 7
7 8
8 9
9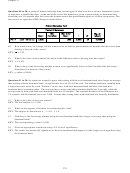 10
10 11
11 12
12 13
13 14
14 15
15 16
16 17
17 18
18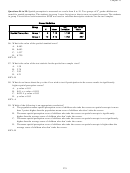 19
19 20
20 21
21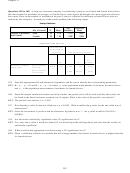 22
22 23
23 24
24 25
25 26
26 27
27 28
28 29
29 30
30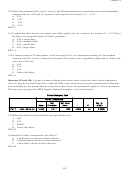 31
31 32
32Chapter 13
th
Questions 96 to 99: Spatial perception is measured on a scale from 0 to 10. Two groups of 8
grade children are
tested for spatial perception. The students in group 1 were first given a short course on spatial concepts. The students
in group 2 received no such instruction. SPSS was used to calculate descriptive statistics for the two samples.
96. What is the value of the pooled standard error?
A. 0.483
B. 0.693
C. 1.537
D. 0.729
KEY: D
97. What is the value of the test statistic for the pooled two sample t-test?
A. 1.39
B. 2.79
C. 2.93
D. 4.21
KEY: B
98. What do we know about the p-value if we wish to test if participation in the course results in significantly
higher spatial perception scores?
A. p-value < 0.01
B. 0.01 < p-value < 0.025
C. 0.025 < p-value < 0.05
D. p-value > 0.05
KEY: A
99. Which of the following is an appropriate conclusion?
A. The population mean spatial perception score of children who take the course on spatial concepts is more
than 2 points higher than the population mean score of children who don’t take the course.
B. The mean spatial perception score of children who take the course on spatial concepts is significantly
higher than the average score of children who don’t take the course.
C. The mean spatial perception score of children who take the course on spatial concepts is not significantly
higher than the average score of children who don’t take the course.
D. The mean spatial perception score of children who take the course on spatial concepts is higher than the
average score of children who don’t take the course.
KEY: B
279
ADVERTISEMENT
0 votes
Related Articles
Related forms


Related Categories
Parent category: Education