Probability Test Worksheets With Answers Page 8
ADVERTISEMENT
 1
1 2
2 3
3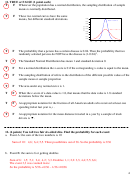 4
4 5
5 6
6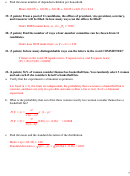 7
7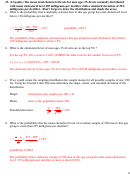 8
8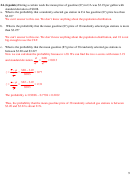 9
923. (13 points) The mean total cholesterol levels for men ages 35-44 are normally distributed
with mean cholesterol level 205 milligrams per deciliter with a standard deviation of 39.2
milligrams per deciliter. (Don’t forget to draw the distribution and shade the area.)
a. What is the probability that a randomly selected man in this age group has total cholesterol level
below 120 milligrams per deciliter?
120 205
x
µ
−
−
2 17
.
probability: 0.015
z
=
=
= −
39 2
.
σ
The probability that a randomly selected man in this age group has total cholesterol level below
120 milligrams per deciliter is about 1.5%.
b. What is the cholesterol level of men ages 35-44 who are in the top 5% ?
For the top 5%, the z-score is 1.645 (INSIDE the table look for the number closest to 0.95)
x = z·σ + µ = 1.645(39.2) + 205 = 269.48
The cholesterol level of men ages 35-44 in the top 5% is 269.48 milligrams per deciliter or more.
c. If we would create the sampling distribution the sample means for all possible samples of size 100
for. Using the Central Limit Theorem determine the shape, center, and standard deviation of the
distribution
Shape:
normal since the sample size 100 > 30
Mean:
same as the population mean: 205
39 2
.
σ
Standard deviation:
3 92
.
=
=
100
n
d. What is the probability that the mean cholesterol level of a random sample of 100 men in this age
group is more than 215 milligrams per deciliter?
215 205
x
µ
−
−
2 55
.
z
=
=
=
3 92
.
σ
n
probability: 0.0054
The probability that a randomly sample of 100 men in this age group has total mean cholesterol
level 215 milligrams per deciliter or more is about 0.54%.
8
ADVERTISEMENT
0 votes
Related Articles
Related forms


Related Categories
Parent category: Education