Algebra Chapter 4 Mid-Chapter Review Functions And Linear Modeling Worksheet With Answer Key Page 5
ADVERTISEMENT
 1
1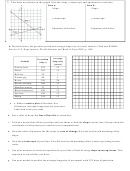 2
2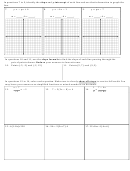 3
3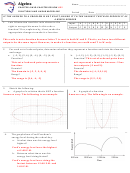 4
4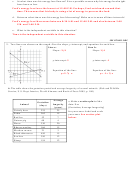 5
5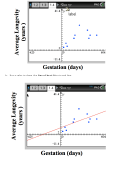 6
6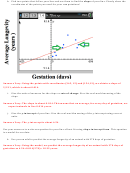 7
7 8
8c. At what time was his energy level lowest? Give a possible reason why his energy level might
have been so low.
Fred’s energy level was the lowest at 12:00 P.M. Perhaps, Fred eats lunch around that
time. This means that his body is using a lot of energy to process the food.
d. Between what times was his energy level decreasing? Make sure to name all time intervals!
Fred’s energy level decreases between 8:30 A.M. and 12:00 P.M. and also between 2:00
P.M. and 3:00 P.M.
e. What is the independent variable in this situation?
Time is the independent variable in this situation.
SEE OTHER SIDE
5. Two lines are shown on the graph. Give the slope, y-intercept, and equation for each line.
Line a:
Line b:
Slope:
-3/4
Slope:
1/4
y-intercept:
3
y-intercept:
-1
Equation of the line:
Equation of the line:
y=3- ¾ x
y= -1+ ¼ x
6. The table shows the gestation period and average longevity of several animals. (Fish and Wildlife
Service, U.S. Dept. Interior, World Almanac and Book of Facts 2005, p. 180)
a. Make a scatter plot of the
Average
Gestation
data. Use
Animal
longevity
(days)
(years)
(Gestation, Average longevity)
Grizzly bear
225
25
for your axes. Label and scale
Zebra
365
15
your axes.
See scatter plot
below.
Red fox
52
7
Guinea pig
68
4
Horse
330
20
Rhesus monkey
166
15
Meadow mouse
21
3
Black rhinoceros
450
15
Sea lion
350
12
Sheep
154
12
ADVERTISEMENT
0 votes
Related Articles
Related forms


Related Categories
Parent category: Education