Favorite Fruit Graph Template Page 4
ADVERTISEMENT
 1
1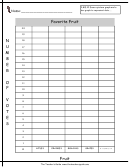 2
2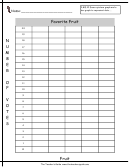 3
3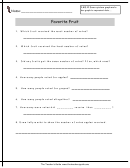 4
4 5
5 6
62.MD.10 Draw a picture graph and a
Name:________________________
bar graph to represent data…..
Favorite Fruit
1. Which fruit received the most number of votes?
_________________________
2. Which fruit received the least number of votes?
_________________________
3. Did any fruits get the same number of votes? If so, which ones?
__________________________
_____________
4. How many people voted for apples?
_____________
5. How many people voted for grapes?
_____________
6. How many people voted altogether?
7. How many more votes did _________ receive than _________ ?
_______________________
8. Draw tally marks to show the number of votes apples received.
_________________________________
The Teacher’s Guide
ADVERTISEMENT
0 votes
Related Articles
Related forms


Related Categories
Parent category: Education