Mathematics Test - 5th Grade, Texas Assessment Of Knowledge And Skills, 2010 Page 19
ADVERTISEMENT
 1
1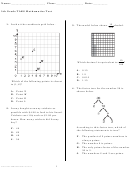 2
2 3
3 4
4 5
5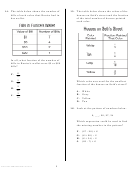 6
6 7
7 8
8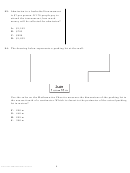 9
9 10
10 11
11 12
12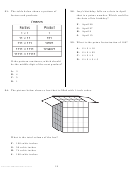 13
13 14
14 15
15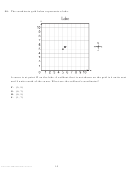 16
16 17
17 18
18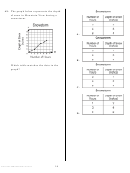 19
19 20
2043. The graph below represents the depth
of snow in Mountain View during a
snowstorm.
A.
B.
Which table matches the data in the
graph?
C.
D.
18
5th Grade TAKS Mathematics Test
ADVERTISEMENT
0 votes
Related Articles
Related forms


 Form")


 Phase-in And Final Recommended Level Ii And Level Iii Performance Standards") State Of Texas Assessments Of Academic Readiness (staar) Phase-in And Final Recommended Level Ii And Level Iii Performance Standards
Life
State Of Texas Assessments Of Academic Readiness (staar) Phase-in And Final Recommended Level Ii And Level Iii Performance Standards
Life
 Mcas Math Test Worksheet With Answer Key - 7th Grade, Massachusetts Department Of Elementary And Secondary Education, 2013
Education
Mcas Math Test Worksheet With Answer Key - 7th Grade, Massachusetts Department Of Elementary And Secondary Education, 2013
Education
 Geometry Reference Materials Formula Chart - State Of Texas Assessments Of Academic Readiness
Education
Geometry Reference Materials Formula Chart - State Of Texas Assessments Of Academic Readiness
Education


Related Categories
Parent category: Education