Unit 2 Lesson 2 Expanded Subtraction Worksheet Page 4
ADVERTISEMENT
 1
1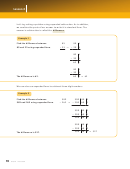 2
2 3
3 4
4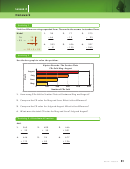 5
52
Lesson
Analyzing Data Using Subtraction
Problem Solving:
How do we find differences in data?
We used bar graphs to display data. Now we will use subtraction to
analyze data in a bar graph. We use subtraction to find the difference
between two pieces of data. The difference represents an increase or
a decrease.
Look at the bar graph below. The graph displays the CD sales for
the Scatter Plots from January through April.
Hipster Records–The Scatter Plots
CDs Sold January–April
5,000
4,000
3,000
2,000
1,000
0
January
February
March
April
Month
Suppose the Scatter Plots’ manager wants to know how many more
CDs were sold in April than in January. We subtract the data in the
graph to determine the difference in sales between the months.
When we analyze data
in a graph, it helps us to
The graph shows that 1,000 CDs were sold in January.
compare information
by finding differences.
It also shows that 4,000 CDs were sold in April.
The differences show an
We solve an extended subtraction fact to find the difference:
increase or decrease.
4,000 − 1,000 = 3,000.
The Scatter Plots sold 3,000 more CDs in April than January.
Problem-Solving Activity
Reinforce Understanding
Turn to Interactive Text, page 55.
Use the mBook Study Guide
to review lesson concepts.
80
Unit 2 • Lesson 2
ADVERTISEMENT
0 votes
Related Articles
Related forms


Related Categories
Parent category: Education