Chapter 4 Study Guide And Review Math Worksheet With Answer Key - Cognero Page 14
ADVERTISEMENT
 1
1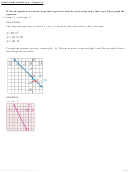 2
2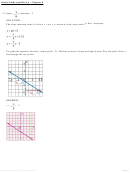 3
3 4
4 5
5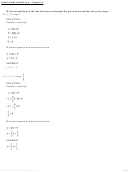 6
6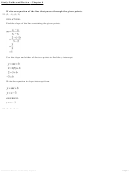 7
7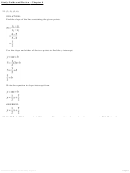 8
8 9
9 10
10 11
11 12
12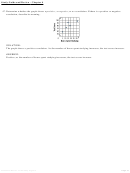 13
13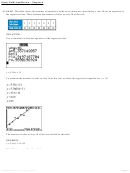 14
14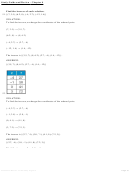 15
15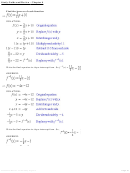 16
16 17
17SOLUTION:
The graph shows a positive correlation. As the number of hours spent studying increases, the test scores increase.
ANSWER:
Study Guide and Review - Chapter 4
Positive; as the number of hours spent studying increases, the test scores increase.
49. SALE The table shows the number of purchases made at an outerwear store during a sale. Write an equation of
the regression line. Then estimate the number of sales on day 10 of the sale.
SOLUTION:
Use a calculator to find the equation of the regression line.
y = 5.36x + 11
To estimate the number of sales on day 10 of the sale, evaluate the regression equation for x = 10.
The number of sales on day 10 of the sale should be about 65.
ANSWER:
y = 5.36x + 11; 65
Find the inverse of each relation.
51. {(7, 3.5), (6.2, 8), (–4, 2.7), (–12, 1.4)}
SOLUTION:
To find the inverse, exchange the coordinates of the ordered pairs.
(7, 3.5) → (3.5, 7)
eSolutions Manual - Powered by Cognero
Page 14
(6.2, 8)
→ (8, 6.2)
ADVERTISEMENT
0 votes
Related Articles
Related forms


Related Categories
Parent category: Education