Stat 110 First Term 1429-1430 H Worksheet With Answers - King Abdulaziz University Page 3
ADVERTISEMENT
 1
1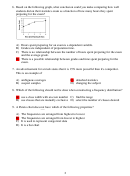 2
2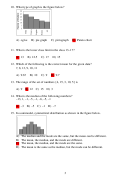 3
310. What type of graph is the figure below?
A) ogive
B) pie graph
C) pictograph
D) Pareto chart
11. What is the lower class limit in the class 13–17?
A) 13
B) 12.5
C) 17
D) 15
12. Which of the following is the correct mean for the given data?
7, 8, 13, 9, 10, 11
A) 9.67
B) 10
C) 9
D) 9.7
13. The range of the set of numbers {4, 15, 3, 10, 5} is
A) 9 B) 12 C) 15 D) 3
14. What is the median of the following numbers?
–13, 1, –1, –5, –1, –6, –5, –1
A) –3 B) –5 C) –1 D) –7
15. In a unimodal, symmetrical distribution as shown in the figure below.
A) The median and the mode are the same, but the mean can be different.
B) The mean, the median, and the mode are different.
C) The mean, the median, and the mode are the same.
D) The mean is the same as the median, but the mode can be different.
3
ADVERTISEMENT
0 votes
Related Articles
Related forms
 Worksheet With Answer Key")
 Worksheet With Answers")
 Worksheet With Answers")
 Worksheet With Answers")
 Worksheet With Answers")
 Worksheet With Answers")
 Worksheet With Answers")
 Worksheet With Answer Key")
 Worksheet With Answer Key")
 Worksheet With Answer Key")
Related Categories
Parent category: Education