Summer Math: Entering Algebra 1 Worksheet Page 5
ADVERTISEMENT
 1
1 2
2 3
3 4
4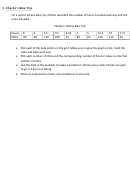 5
5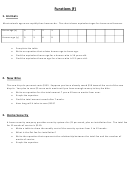 6
6 7
7 8
83.
On a recent 10-‐day bike trip, Charlie recorded the number of hours he biked each day and the
miles traveled.
-‐ D ay Bike Trip
Hours
8
4
10
9.5
4.25
7
5
12.5
10
7.75
Miles
90
48
110
100
51
80
65
120
112
93
Plot each of the data points on the grid. Make sure to give the graph a title, mark the
scale and label each axis.
Plot each number of miles and the corresponding number of hours it takes to ride that
number of miles.
Use the data in the problem to make a prediction of how many miles Charlie can plan
to go in 6 hours of biking.
Write an explanation of why your prediction is accurate.
ADVERTISEMENT
0 votes
Related Articles
Related forms


Related Categories
Parent category: Education