Categorical Or Quantitative Variables, Histogram, Pie-Chart And Bar Graph Worksheet Page 2
ADVERTISEMENT
 1
1 2
2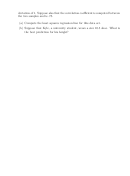 3
38. A student received the following grades on quizzes in a history course: 80, 88,
75, 93, 79, 95, 75, and 96.
Find the mean, and median, and the first and second quartiles of this data.
Also compute the standard deviation.
9. Suppose that the weight of a molar is normal with mean 30mg and standard
deviation 4mg. What portion of molars weigh on average will more than 31mg?
10. To make a knife, a steel blank has to be cut so that it is longer than 7 inches
but shorter than 7.3 inches. Suppose the length of steel blanks which are man-
ufactured follows a normal distribution with mean 7.25 inches and a standard
1
deviation of
of an inch. What portion of the blanks manufactured on average
8
will meet these specifications?
11. The wingspan of a falcon in feet follows a N(3.3,.1) distribution. What portion
of observations of the wingspan of falcons do you expect to find between 3.1
and 3.5 feet?
12. The wingspan of a falcon in feet follows a N(3.3,.1) distribution. How large
must a bird’s wingspan be in order to place it in the top 10% of all falcons?
13. A circus is recruiting chimpanzees for a show, and they want the chimpanzees
to be either really tall, or really short. The heights of monkeys follow a normal
distribution with mean 4 feet and standard deviation 6 inches. If the circus
purchases a whole barrel of chimps, what portion do you expect to have heights
larger than 5 feet and smaller than 3 feet 7 inches?
14. The data below relates the weights of fruitflys (in micro grams) to the number
Fruit Fly Weight Number of offspring
1
22
43
2
26
47
3
19
40
of offspring they produce.
4
17
38
5
27
50
6
21
42
7
26
46
(a) Create a scatter plot for this data.
(b) Does the data exhibit a positive or negative association?
(c) What is an estimate for the correlation coefficient for this data?
15. Suppose that the heights and shoe sizes are measured of a sample of men from
the University. It is found that the mean height of this sample is 6 feet with a
standard deviation of .5 feet, and that the mean shoe size is a 10 with a standard
ADVERTISEMENT
0 votes
Related Articles
Related forms


Related Categories
Parent category: Education