Logarithms And Logarithmic Functions Worksheet With Answers Page 23
ADVERTISEMENT
 1
1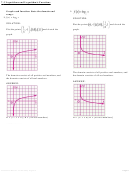 2
2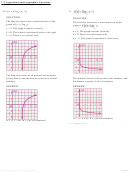 3
3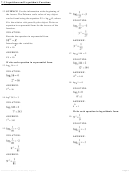 4
4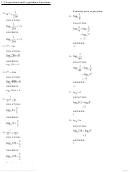 5
5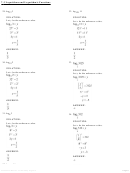 6
6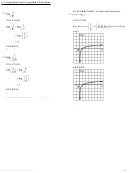 7
7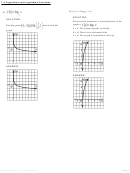 8
8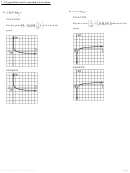 9
9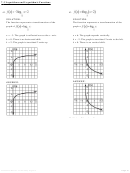 10
10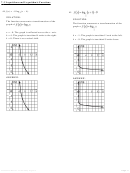 11
11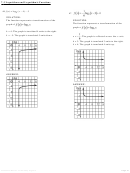 12
12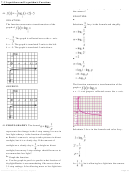 13
13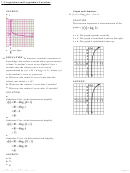 14
14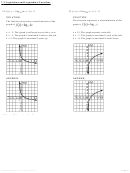 15
15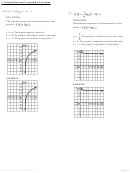 16
16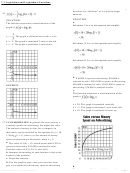 17
17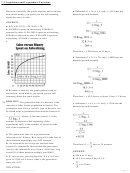 18
18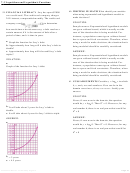 19
19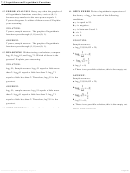 20
20 21
21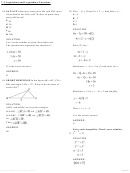 22
22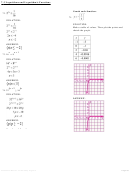 23
23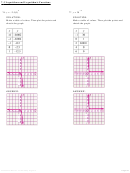 24
24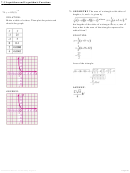 25
25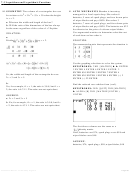 26
26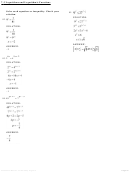 27
27ANSWER:
ANSWER:
7-3 Logarithms and Logarithmic Functions
Graph each function.
72.
75.
SOLUTION:
SOLUTION:
Make a table of values. Then plot the points and
sketch the graph.
ANSWER:
n
n + 1
73. 16
< 8
SOLUTION:
ANSWER:
5p + 2
5p
74. 32
≥ 16
SOLUTION:
ANSWER:
ANSWER:
Graph each function.
75.
x
76. y = −2.5(5)
SOLUTION:
SOLUTION:
Make a table of values. Then plot the points and
Make a table of values. Then plot the points and
sketch the graph.
sketch the graph.
eSolutions Manual - Powered by Cognero
Page 23
ADVERTISEMENT
0 votes
Related Articles
Related forms


 - Function Worksheet With Answers")
 - Function Worksheet With Answers")
 - Function Worksheet With Answers")


Related Categories
Parent category: Education