Radioactive Decay, Isotopes Worksheet With Answers Page 6
ADVERTISEMENT
 1
1 2
2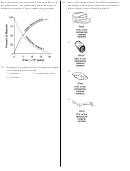 3
3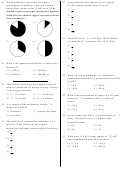 4
4 5
5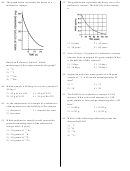 6
6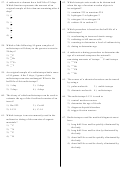 7
7 8
8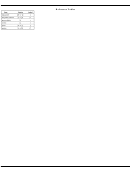 9
9 10
10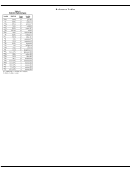 11
11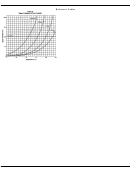 12
12 13
13 14
1448. The graph below represents the decay of a
52. The graph below represents the decay curve of a
radioactive isotope.
radioactive isotope. The half-life of this isotope
is
1) 8 years
3) 45 years
2) 30 years
4) 60 years
53. After 30 days, 5.0 grams of a radioactive isotope
remains from an original 40.-gram sample. What
is the half-life of this element?
Based on Reference Table H, which
1) 5 days
3) 15 days
radioisotope is best represented by the graph?
2) 10 days
4) 20 days
32
1)
P
131
2)
I
54. Approximately how many grams of a 40-gram
198
3)
Au
131
sample of
I will remain unchanged after 24
53
222
4)
Rn
days?
1) 5
3) 13
49. Which sample will decay least over a period of
2) 10
4) 20
30 days?
1) 10 g of Au-198
3) 10 g of P-32
55. The half-life of a radioactive isotope is 20.0
2) 10 g of I-131
4) 10 g of Rn-222
minutes. What is the total amount of a 1.00-
gram sample of this isotope remaining after 1.00
50. As the temperature of a sample of a radioactive
hour?
element decreases, the half-life of the element
1) 0.500 g
3) 0.250 g
1) decreases
3) remains the same
2) 0.333 g
4) 0.125 g
2) increases
56. Which of the following radioisotopes has the
51. Which radioactive sample would contain the
shortest half-life?
greatest remaining mass of the radioactive
14
1)
C
isotope after 10 years?
3
2)
H
198
1) 2.0 grams of
Au
37
3)
K
42
2) 2.0 grams of
K
32
4)
P
32
3) 4.0 grams of
P
60
4) 4.0 grams of
Co
ADVERTISEMENT
0 votes
Related Articles
Related forms


")

Related Categories
Parent category: Education