Fishbone Diagram Worksheet
ADVERTISEMENT
 1
1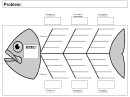 2
2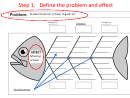 3
3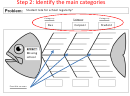 4
4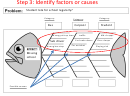 5
5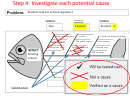 6
6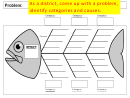 7
7Fishbone Diagram
A fishbone diagram, cause-and-effect diagram, is
used to visually identify problems and their causes.
1) Define the problem and effect
2) Identify the main categories that determine the possible causes
3) Create sub branches of the categories that represent potential causes
4) Spend time investigating each potential cause
ADVERTISEMENT
0 votes
Related Articles
Related forms


Related Categories
Parent category: Education