Regents High School Examination Worksheet - Integrated Algebra, The University Of The State Of New York, 2011 Page 7
ADVERTISEMENT
 1
1 2
2 3
3 4
4 5
5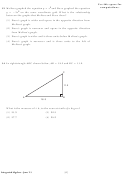 6
6 7
7 8
8 9
9 10
10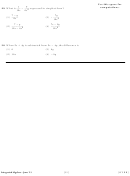 11
11 12
12 13
13 14
14 15
15 16
16 17
17 18
18 19
19 20
20 21
21 22
22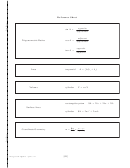 23
23 24
24Use this space for
computations.
15 The maximum height and speed of various roller coasters in North
America are shown in the table below.
Maximum Speed,
45
50
54
60
65
70
in mph, (x)
Maximum Height,
63
80
105
118
141
107
in feet, (y)
Which graph represents a correct scatter plot of the data?
y
y
80
140
70
120
60
100
50
80
40
60
x
x
60
80 100
120 140
40
50 60
70 80
Max Height, in feet
Max Speed, in mph
(1)
(3)
y
y
140
80
120
70
100
60
80
50
60
40
x
x
40
50 60
70 80
60
80 100
120 140
Max Speed, in mph
Max Height, in feet
(2)
(4)
16 Which set of ordered pairs represents a function?
(1) {(0,4), (2,4), (2,5)}
(3) {(4,1), (6,2), (6,3), (5,0)}
(2) {(6,0), (5,0), (4,0)}
(4) {(0,4), (1,4), (0,5), (1,5)}
[7]
[OVER]
Integrated Algebra – June ’11
ADVERTISEMENT
0 votes
Related Articles
Related forms
 Regents High School Examination - Mathematics A Answers - The University Of The State Of New York - 2011
Education
Regents High School Examination - Mathematics A Answers - The University Of The State Of New York - 2011
Education
 Algebra 2/trigonometry Regents High School Examination Worksheet - The University Of The State Of New York, 2015
Education
Algebra 2/trigonometry Regents High School Examination Worksheet - The University Of The State Of New York, 2015
Education
 Mathematics B Regents High School Examination Worksheet - The University Of The State Of New York, 2004
Education
Mathematics B Regents High School Examination Worksheet - The University Of The State Of New York, 2004
Education
 Mathematics B Regents High School Examination Worksheet- University Of The State Of New York, 2007
Education
Mathematics B Regents High School Examination Worksheet- University Of The State Of New York, 2007
Education
 Integrated Algebra Worksheet - The University Of The State Of New York Regents High School Examination
Education
Integrated Algebra Worksheet - The University Of The State Of New York Regents High School Examination
Education
 Regents High School Examination - Integrated Algebra Worksheet - The University Of The State Of New York, 2010
Education
Regents High School Examination - Integrated Algebra Worksheet - The University Of The State Of New York, 2010
Education
 Regents High School Examination - Integrated Algebra Worksheet - The University Of The State Of New York - 2009
Education
Regents High School Examination - Integrated Algebra Worksheet - The University Of The State Of New York - 2009
Education
 Regents High School Examination - Integrated Algebra Worksheet - The University Of The State Of New York, 2010
Education
Regents High School Examination - Integrated Algebra Worksheet - The University Of The State Of New York, 2010
Education


Related Categories
Parent category: Education