Math Exam Final Review Worksheet With Answer Key - M118, Indiana University Southeast Page 7
ADVERTISEMENT
 1
1 2
2 3
3 4
4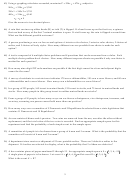 5
5 6
6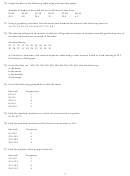 7
7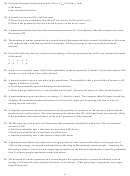 8
8 9
9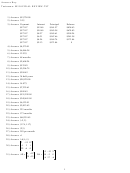 10
10 11
11 12
1270) Graph the data in the following table using a broken line graph:
Number of Inches of Snowfall Per Last 6 Winters in Our Area
93-94
94-95
95-96
96-97
97-98
98-99
29.9
4.0
24.2
5.3
22.8
8.2
71) Using a graphing calculator, find the mean and standard deviation for the following data set:
1.5, 3.5, 2.2, 7.9, 4.3, 2.0, 11.8, 13.7, 15.7, 6.4
72) The starting salaries (in thousands of dollars) of 20 graduates chosen at random from the graduating class of
an urban university are recorded in the table:
Starting Salaries
32 37 30 23 29 25 40 26 41 34
33 30 27 31 42 24 35 38 36 35
a) Construct a frequency and relative frequency table using a class interval width of 4 and starting at 20.5.
b) Construct a histogram.
73) Given the data set: 200, 700, 300, 300, 900, 300, 400, 200, 500, 600, find the following:
a) the mean
b) the mode
c) the median
d) the range
74) Given the following grouped data, find the mean:
Intervals
Frequencies
0.5-2.5
1
2.5-4.5
3
4.5-6.5
8
6.5-8.5
5
8.5-10.5
3
75) Find the standard deviation of set this set of four math test grades:
78, 92, 85, 70
76) Find the standard deviation of this data set whose mean is 15.8:
Intervals
Frequency
9.5-12.5
3
12.5-15.5
6
15.5-18.5
7
18.5-21.5
4
77) Find the median of this grouped data set:
Intervals
Frequency
9.5-12.5
2
12.5-15.5
3
15.5-18.5
6
18.5-21.5
4
7
ADVERTISEMENT
0 votes
Related Articles
Related forms


Related Categories
Parent category: Education