Gcse Grade C Exam Practice Worksheet With Answer Key - Alperton Community School Page 24
ADVERTISEMENT
 1
1 2
2 3
3 4
4 5
5 6
6 7
7 8
8 9
9 10
10 11
11 12
12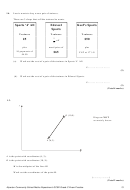 13
13 14
14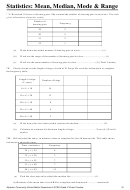 15
15 16
16 17
17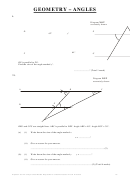 18
18 19
19 20
20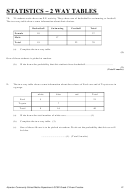 21
21 22
22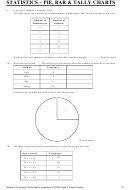 23
23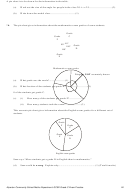 24
24 25
25 26
26 27
27 28
28A pie chart is to be drawn for the information in the table.
Work out the size of the angle for people in the class 20 ≤ t < 25...................................(2)
(a)
(b)
Write down the modal class......................................(1)
*4.
The pie chart gives information about the mathematics exam grades of some students.
Grade
C
Grade
F
40°
80°
Grade
100°
D
140°
Grade
E
Mathematics exam grades
Diagram NOT accurately drawn
(a)
What grade was the mode?........................(1)
(b)
What fraction of the students got grade D?
........................(1)
8 of the students got grade C.
(c)
(i)
How many of the students got grade F?........................
(ii)
How many students took the exam?........................(3)
This accurate pie chart gives information about the English exam grades for a different set of
students.
Grade
F
Grade
C
Grade
Grade
E
D
English exam grades
Sean says “More students got a grade D in English than in mathematics.”
(d)
Sean could be wrong. Explain why...................................................... (1) (Total 6 marks)
Alperton Community School Maths Department: GCSE Grade C Exam Practice
24
ADVERTISEMENT
0 votes
Related Articles
Related forms
 Mat1033 Practice Exam 5 Worksheet With Answer Key - Professor George Jahn, Palm Beach State College
Education
Mat1033 Practice Exam 5 Worksheet With Answer Key - Professor George Jahn, Palm Beach State College
Education


 Solving Quadratic Equations By Factoring Worksheet With Answer Key - Tallahassee Community College
Education
Solving Quadratic Equations By Factoring Worksheet With Answer Key - Tallahassee Community College
Education


Related Categories
Parent category: Education