Probability Of Traits In A Population Worksheets - Mr. Mullany Page 3
ADVERTISEMENT
 1
1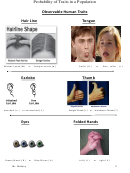 2
2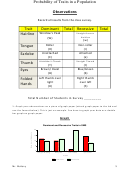 3
3 4
4 5
5Probability of Traits in a Population
Observations
Record all results from the class survey.
Trait
Dominant
Total Recessive
Total
Window’s Peak
Straight Across
Hairline
Hairline
(W)
(w)
Roller
Non-roller
Tongue
(R)
(r)
Unattached
Attached
Earlobe
(E)
(e)
Hitchhiker’s Thumb
Straight Thumb
Thumb
(T)
(t)
Brown/ Hazel
Blue/Green
Eyes
(B)
(b)
Left thumb over
Right thumb
Folded
right
over left
Hands
(H)
(h)
Total Number of Students in Survey _________
1- Graph your observations on a piece of graph paper (attach graph paper to the lab and
use the format below). This is just an example. You have to graph your data as a double
bar graph on graph paper.
Graph
Dominant and Recessive Traits in SMS
20
15
10
5
0
Tongue Rolling
Dimples
Ear Lobes
eye Color
Traits
Dominant
Recessive
Mr. Mullany
3
ADVERTISEMENT
0 votes
Related Articles
Related forms


Related Categories
Parent category: Education