Mathematics B Regents High School Examination Worksheet - The University Of The State Of New York, 2004 Page 7
ADVERTISEMENT
 1
1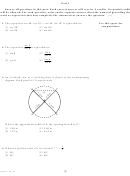 2
2 3
3 4
4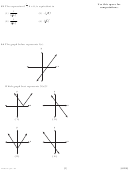 5
5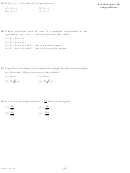 6
6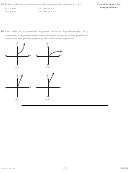 7
7 8
8 9
9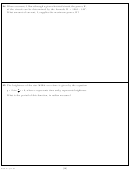 10
10 11
11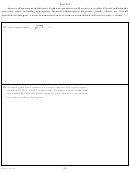 12
12 13
13 14
14 15
15 16
16 17
17 18
18 19
19 20
20 21
21 22
22 23
23 24
242
19 What is the axis of symmetry of the graph of the equation x = y
?
Use this space for
computations.
(1) x-axis
(3) line y = x
(2) y-axis
(4) line y = –x
20 The cells of a particular organism increase logarithmically. If g
represents cell growth and h represents time, in hours, which graph best
represents the growth pattern of the cells of this organism?
g
g
h
h
( 1 )
( 3 )
g
g
h
h
( 2 )
( 4 )
[7]
[OVER]
Math. B –Jan. ’04
ADVERTISEMENT
0 votes
Related Articles
Related forms
 Regents High School Examination - Mathematics B Worksheet - The University Of The State Of New York, 2004
Education
Regents High School Examination - Mathematics B Worksheet - The University Of The State Of New York, 2004
Education
 Regents High School Examination - Mathematics B Worksheet - The University Of The State Of New York, 2004
Education
Regents High School Examination - Mathematics B Worksheet - The University Of The State Of New York, 2004
Education
 Mathematics B Regents High School Examination Worksheet- University Of The State Of New York, 2007
Education
Mathematics B Regents High School Examination Worksheet- University Of The State Of New York, 2007
Education
 Mathematics B Regents High School Examination - The University Of The State Of New York, 2007
Education
Mathematics B Regents High School Examination - The University Of The State Of New York, 2007
Education
 Mathematics B Regents High School Examination - The University Of The State Of New York, 2006
Education
Mathematics B Regents High School Examination - The University Of The State Of New York, 2006
Education
 Mathematics B Regents High School Examination - The University Of The State Of New York, 2006
Education
Mathematics B Regents High School Examination - The University Of The State Of New York, 2006
Education
 Mathematics B - Regents High School Examination - The University Of The State Of New York - 2009
Education
Mathematics B - Regents High School Examination - The University Of The State Of New York - 2009
Education


Related Categories
Parent category: Education