Lesson 6-5 Point-Slope Form And Writing Linear Equations Worksheet With Answers Page 3
ADVERTISEMENT
 1
1 2
2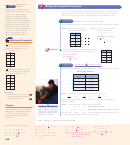 3
3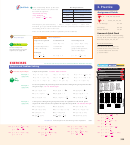 4
4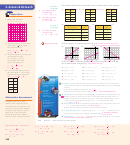 5
5 6
6Connection to
1 2
5
5
EXAMPLE
EXAMPLE
Writing Linear Equations Using Data
Part 2 Writing Linear Equations from Data
Science
Boiling point is defined as the
You can write a linear equation to model data in tables. Two sets of data have a
temperature at which the vapor
linear relationship if the rate of change between consecutive pairs of data is the
pressure of a liquid slightly
same. For data that have a linear relationship, the rate of change is the slope.
exceeds the pressure of the
atmosphere above the liquid.
Water at 1 atmosphere pressure
4
4
EXAMPLE
Writing an Equation Using a Table
EXAMPLE
boils at 212° F. If the pressure on
a liquid is reduced, the boiling
Is the relationship shown by the data linear? If so, model the data with an equation.
point is lowered. Air pressure is
Step 1 Find the rate of change for
Step 2 Use the slope and a point
less at higher elevations. Denver,
Colorado is 1 mile above sea
consecutive ordered pairs.
to write an equation.
level, so the boiling point of
y - y
= m (x - x
)
1
1
x
y
water there averages 201° F.
1
4
Substitute (5, 7) for (x
, y
)
2
1
1
1
4
2
1
PowerPoint
4
2
and for m
.
2
3
6
1
1
Additional Examples
2
1
1
y - 7 =
(x 2 5)
2
2
5
7
2
3
1
6
3
4
4
Is the relationship shown by
6
2
11
10
the data linear? If so, model the
data with an equation.
yes;
Quick Check
4
4
Is the relationship shown by the data at the right
x
y
y – 4 ≠ 2(x – 2)
linear? If so, model the data with an equation.
11
7
x
y
Yes; answers may
1
3
3
6
vary. Sample:
y – 5 ≠ (x – 19)
2
4
1
2
4
5
19
5
-1
-2
5
-3
-6
5
Real-World
Problem Solving
EXAMPLE
EXAMPLE
Is the relationship shown by the data linear? If so, model the data with an equation.
5
5
Is the relationship shown by
the data linear? If so, model the
Boiling Point of Water
data with an equation.
no
Altitude
Temperature
x
y
(1000 ft)
(ºF)
-2
-2
8
197.6
3.5
6.3
-1
-1
4.5
203.9
1.5
2.7
1
0
3
206.6
0.5
0.9
2
1
2.5
207.5
Resources
Step 1 Find the rates of change for consecutive ordered pairs.
L3
• Daily Notetaking Guide 6-5
6.3
2.7
0.9
= -1.8
= -1.8
= -1.8
23.5
21.5
20.5
• Daily Notetaking Guide 6-5—
L1
Adapted Instruction
The relationship is linear. The rate of change is -1.8 degrees Fahrenheit per
1000 ft of altitude.
Step 2 Use the slope and a point to write an equation.
Closure
Real-World
Connection
y - y
= m (x - x
)
Use the point-slope form.
1
1
At 5280 feet above sea level it
Ask students to write a set of data
y -
= -1.8(x - 3)
) and –1.8
206.6
Substitute (3, 206.6) for (x
, y
for m .
takes 17 minutes to hard-boil
1
1
that is linear, and then model the
an egg. This is more than 40%
The equation y - 206.6 = -1.8(x - 3) relates altitude in thousands of feet x to
longer than it takes the same
data with an equation. Have
the boiling point temperature in degrees Fahrenheit.
egg to cook at sea level.
them graph the data and the
equation.
338
Chapter 6
Linear Equations and Their Graphs
pages 339–341 Exercises
3
1
19. y ≠ 1(x ± 1);
13. y ± 7 ≠ – (x ± 2)
17. y ± 8 ≠ – (x – 1)
5
2
y ≠ x ± 1
10. y ± 4 ≠ 6(x – 3)
2
14. y ≠ 1(x – 4)
18. y – 1 ≠ (x ± 6)
3
5
20. y – 5 ≠ (x – 3);
5
11. y – 2 ≠ – (x – 4)
3
15. y ± 8 ≠ –3(x – 5)
19–30. Answers may vary from
3
5
y ≠ x
3
4
the point indicated by
12. y – 2 ≠ (x)
16. y – 2 ≠ 0(x ± 5) or
5
the equation.
y ≠ 2
338
ADVERTISEMENT
0 votes
Related Articles
Related forms


Related Categories
Parent category: Education