Part 1 Module 3 Venn Diagrams And Survey Problems Worksheet With Answers
ADVERTISEMENT
 1
1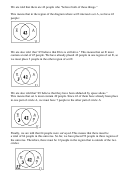 2
2 3
3 4
4 5
5 6
6 7
7 8
8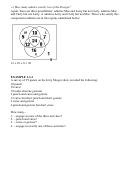 9
9 10
10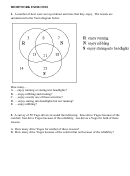 11
11 12
12 13
13 14
14PART 1 MODULE 3
VENN DIAGRAMS AND SURVEY PROBLEMS
EXAMPLE 1.3.1
A survey of 64 informed voters revealed the following information:
45 believe that Elvis is still alive
49 believe that they have been abducted by space aliens
42 believe both of these things
1. How many believe neither of these things?
2. How many believe Elvis is still alive but don't believe that they have been
abducted by space aliens?
SOLUTION TO EXAMPLE 1.3.1
When we first read the data in this example, it may seem as if the numbers contradict one
another. For instance, we were told that 64 people were surveyed, yet there are 45 who
believe that Elvis is alive and 49 who believe that they've been kidnapped by space
aliens. Obviously, 45 + 49 is much greater than 64, so it appears that the number of
people who responded to the survey is greater than the number of people who were
surveyed. This apparent contradiction is resolved, however, when we take into account
the fact that there are some people who fall into both categories ("42 believe both of
those things").
A Venn diagram is useful in organizing the information in this type of problem. Since
the data refers to two categories, we will use a two-circle diagram.
Let U be the set of people who were surveyed.
Let E be the set of people who believe that Elvis is still alive.
Let A be the set of people who believe that they have been abducted by space aliens.
Then we have the following Venn diagram showing the relationship between sets
E, A and U:
ADVERTISEMENT
0 votes
Related Articles
Related forms


Related Categories
Parent category: Education