Module 1, Sec. 3.5 Equations Of Lines Worksheet Page 3
ADVERTISEMENT
 1
1 2
2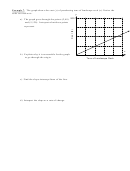 3
3Example 7: The graph shows the cost (y) of purchasing tons of landscape rock (x). Notice the
scale on each axis.
y
200
a) The graph goes through the points (2,48)
and (5,120). Interpret what these points
represent.
x
b) Explain why it is reasonable for the graph
5
to go through the origin.
Tons of Landscape Rock
c) Find the slope-intercept form of the line.
d) Interpret the slope as a rate of change.
ADVERTISEMENT
0 votes
Related Articles
Related forms


Related Categories
Parent category: Education