Summer Math Packet Worksheet - 8th Grade, Grayslake Middle School Page 12
ADVERTISEMENT
 1
1 2
2 3
3 4
4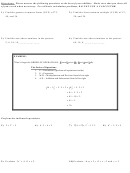 5
5 6
6 7
7 8
8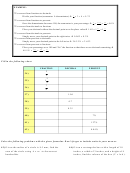 9
9 10
10 11
11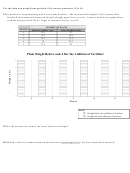 12
12 13
13 14
14Use the data and graph from question 54 to answer questions 55 & 56.
54) A botanist is experimenting with a new plant fertilizer. She measured the heights of five plants, then
fertilized each plant and measured the plant height again in two weeks. Create a double bar graph below
with the data provided. Don’t forget to complete the key as well.
H
P
EIGHT OF
LANT
P
LANT
Before Fertilizer (cm)
After Fertilizer (cm)
1
12.5
17
2
15.5
19.5
3
13.5
17.5
4
18
22.5
5
17.5
23
Plant Height Before and After the Addition of Fertilizer
25
20
15
10
5
0
1
2
3
4
5
Plants
K
:
EY
Height before the addition of fertilizer
Height after the addition of fertilizer
55) To the nearest cm, what is the mean increase in height?
56) Which of the five plants increased the most on a percentage basis? By how much did it increase?
ADVERTISEMENT
0 votes
Related Articles
Related forms


Related Categories
Parent category: Education