The Inverse Of A Quadratic Functions Worksheet Page 7
ADVERTISEMENT
 1
1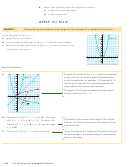 2
2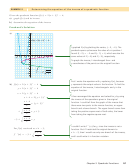 3
3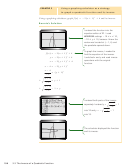 4
4 5
5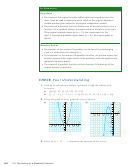 6
6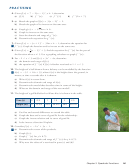 7
7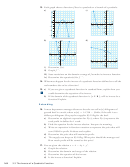 8
8PRACTISING
2
Given
f (x) 5 7 2 2(x 2 1)
,
x $ 1,
determine
4.
21
21
21
f (3)
f
(x)
f
(5)
f
(2a 1 7)
a)
b)
c)
d)
2
a) Sketch the graph of
f (x) 5 3(x 2 2)
2 2.
5.
b) Sketch the graph of its inverse on the same axes.
g(x) 5 2 ! x
a) Graph
for
x $ 0.
6.
b) Graph its inverse on the same axes.
21
c) State the domain and range of
g
(x).
21
d) Determine the equation for
g
(x).
2
Given
f (x) 5 2 (x 1 1)
2 3
for
x $ 21,
determine the equation for
7.
K
21
f
(x).
Graph the function and its inverse on the same axes.
1
2
21
Given
f (x) 5
(x 2 5)
1 3,
find the equation for
f
(x)
for the part of
8.
2
21
the function where
x # 5.
Use a graphing calculator to graph
f
(x).
2
For
22 , x , 3
and
f (x) 5 3x
2 6x,
determine
9.
a) the domain and range of
f (x)
21
b) the equation of
f
(x)
if
f (x)
is further restricted to
1 , x , 3
The height of a ball thrown from a balcony can be modelled by the function
10.
2
A
h(t) 5 25t
1 10t 1 35,
where
h(t)
is the height above the ground, in
metres, at time t seconds after it is thrown.
a) Write
h(t)
in vertex form.
b) Determine the domain and range of
h(t).
c) Determine the model that describes time in terms of the height.
d) What are the domain and range of the new model?
The height of a golf ball after Lori Kane hits it is shown in the table.
11.
Time (s)
0
0.5
1
1.5
2
2.5
Height (m)
0
12.375
22.5
30.375
36.0
39.375
a) Use first and second differences to extend the table.
b) Graph the data and a curve of good fit for the relationship.
c) Graph the inverse relation and its curve of good fit.
d) Is the inverse a function? Explain.
2
Consider
f (x) 5 22x
1 3x 2 1.
12.
T
a) Determine the vertex of the parabola.
b) Graph
f (x).
21
c) Graph
f
(x)
for
y $ 0.75.
21
d) Determine the domain and range of
f
(x)
for
y $ 0.75.
e) Why were the values of x restricted in parts (c) and (d)?
Chapter 3 Quadratic Functions
161
ADVERTISEMENT
0 votes
Related Articles
Related forms


 Examples And Worksheet - Algebra Unit 11-graphing Quadratics")


Related Categories
Parent category: Education