Junior Lyceum Annual Examinations In Physics Form 5 - 2011 Page 9
ADVERTISEMENT
 1
1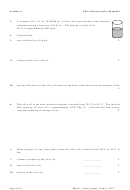 2
2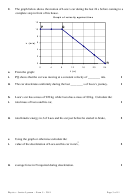 3
3 4
4 5
5 6
6 7
7 8
8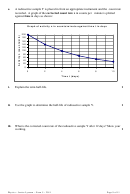 9
9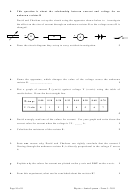 10
10 11
11e.
A radioactive sample Y is placed in front an appropriate instrument and the count rate
recorded. A graph of the corrected count rate n in counts per minute is plotted
against time in days as shown:
Graph of activity n in counts/minute against time t in days
200
180
160
140
120
100
80
60
40
20
0
0
2
4
6
8
10
Time t (days)
i.
1
Explain the term half-life.
ii.
1
Use the graph to determine the half-life of radioactive sample Y.
iii.
What is the corrected count rate of the radioactive sample Y after 12 days? Show your
1
working.
Physics – Junior Lyceum – Form 5 – 2011
Page 9 of 11
ADVERTISEMENT
0 votes
Related Articles
Related forms


 Physics Secondary School Annual Examinations Form 5 - Directorate For Quality And Standards In Education, 2011
Education
Physics Secondary School Annual Examinations Form 5 - Directorate For Quality And Standards In Education, 2011
Education
 Physics Annual Examinations For Secondary Schools Form 5 - Directorate For Quality And Standards In Education, 2014
Education
Physics Annual Examinations For Secondary Schools Form 5 - Directorate For Quality And Standards In Education, 2014
Education
 Physics Annual Examinations For Secondary Schools Form 5 - Directorate For Quality And Standards In Education, 2012
Education
Physics Annual Examinations For Secondary Schools Form 5 - Directorate For Quality And Standards In Education, 2012
Education
 Physics Annual Examinations For Secondary Schools Form 5 - Directorate For Quality And Standards In Education, 2013
Education
Physics Annual Examinations For Secondary Schools Form 5 - Directorate For Quality And Standards In Education, 2013
Education
 Physics Annual Examinations For Secondary Schools Form 5 - Directorate For Quality And Standards In Education, 2013
Education
Physics Annual Examinations For Secondary Schools Form 5 - Directorate For Quality And Standards In Education, 2013
Education
 Worksheets - Department For Curriculum Management")


Related Categories
Parent category: Education