Water Quality Testing Worksheet Page 3
ADVERTISEMENT
 1
1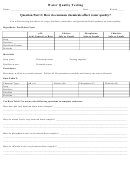 2
2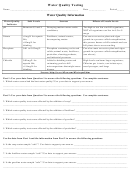 3
3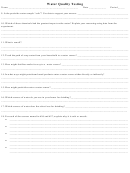 4
4Water Quality Testing
Name _________________________________________________
Date ____________
Period_____
Water Quality Information
Water Quality
Safe Levels
Sources
Effects of Unsafe Levels
Indicator
pH
Between 6.5 and 9
Decaying matter causes acidic
Too high or too low can kill organisms;
conditions;
NOT all organisms can live in 6.5 to 9
range
Nitrate
<1mg/L for aquatic
Fertilizers, animal wastes,
Can cause excessive plant and algae
life;
decomposing matter
growth in a process called eutrophication;
<10mg/L for
this process harms or kills animals and can
drinking
kill plants due to overcrowding
Phosphate
0.01 to 0.03mg/L
Phosphate containing rocks and
Can also cause excessive plant and algae
solids; animal waste, fertilizers,
growth in a process called eutrophication;
pesticides, cleaning products,
(see above);
and industrial processes
Chloride
0.01mg/L for
Added to drinking water and
High levels can harm larger organisms;
aquatic life;
swimming pools to kill
Chlorine gas is toxic, can irritate eyes,
<1.0mg/L for
microorganisms that might cause
nasal passages, and lungs
drinking
disease
Source:
Part 1: Use your data from Question 1 to answer the following questions. Use complete sentences.
1. Which water source had the best water quality? Use your data to support your answer.
__________________________________________________________________________________________________
__________________________________________________________________________________________________
Part 2: Use your data from Question 2 to answer the following questions. Use complete sentences.
2. Which water quality tests were affected by the addition of soap? ____________________________________________
__________________________________________________________________________________________________
3. Which water quality tests were affected by the addition of fertilizer? _________________________________________
__________________________________________________________________________________________________
4. Which water quality tests were affected by the addition of gasoline? _________________________________________
__________________________________________________________________________________________________
5. Which water quality tests were affected by the addition of pesticides? ________________________________________
__________________________________________________________________________________________________
Use the data from Part 1 and the information from Part 2 to answer the following questions:
6. Is the soap water sample “safe”? Use data to support your answer. __________________________________________
__________________________________________________________________________________________________
7. Is the fertilizer water sample “safe”? Use data to support your answer. _______________________________________
__________________________________________________________________________________________________
8. Is the gasoline water sample “safe”? Use data to support your answer. _______________________________________
__________________________________________________________________________________________________
ADVERTISEMENT
0 votes
Related Articles
Related forms


")


Related Categories
Parent category: Education