Psy 2030 Final Grade Distribution Fall 2016
ADVERTISEMENT
 1
1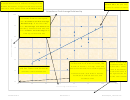 2
2 3
3Customize the pie chart as
Create a pie chart from the Final
follows:
Grade Distribution data located in
Apply Style 7 chart style;
the Grades worksheet, range
F38:G42, and move the chart to a
PSY 2030 Final Grade Distribution - Fall 2016
Enter "PSY 2030 Final
chart sheet renamed "Grades Pie"
Grade Distribution - Fall
2016" in the chart title;
Add centered data labels
showing Percentage and
Explode the B grade slice;
Category Name; no values
and remove the legend
and format the data labels as
28 pt font size; Black, Text
1 font color, and bold
F
A
12%
15%
D
15%
B
27%
C
31%
Create a footer with student's
name in left section, sheet
name in the center, and the file
name in the right section for
the two chart sheets
Student Name
Grades Pie
e03m2Psych_LastFirst.xlsx
ADVERTISEMENT
0 votes
Related Articles
Related forms
")


Related Categories
Parent category: Education