Whale Of A Time Worksheet Page 2
ADVERTISEMENT
 1
1 2
2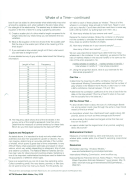 3
3 4
4Whale of a
Time-continued
6.
Which measure of central tendency
best
represents each type
of whale's average length? Is it the same for each? Why?
Stem-and-Leaf
Plots
Stem-and-Ieaf plots are a way to organize data elements from
least to
greatest.
A stem-and-Ieaf
plot also shows how the
elements are
grouped,
often into sets of ones or
tens.
First,
determine the smallest and largest value in the data
set.
Then
determine how to break down the data (by
ones, tens,
hundreds,
etc.) based on what will fit well on a
plot.
List these groups
vertically (this is called the
stem). Next,
list-in
numerical order
-all
the data elements on the stem where they belong (these
are called the leaves). Here is
an
example
of
a
stem-and-Ieaf
plot using the length
of
gray
whales:
Gray Whales' Length
(
12
Stem
13
14
~1457778)
Leaves
01
Key:
1317
=
13.7 feet
The stem ends in the ones place because the data are between
12.9 and 14.1. The above example shows the fact that most
of
the data are represented
on leaf
13,
meaning that the numbers
are between and including
13.0 and 13.9. Also note how the key
provides the information
needed to interpret the
data,
both with
place value and
label.
Stem-and-Ieaf
plots can also be used to display two sets
of
data,
using a back-to-back
stem-and-Ieaf
plot.
In this type
of
plot, the
two sets of data have a common stem and are listed
on both
sides of the stem. The data on the left side
of
the
stem
are
listed
in greatest to least order (so
that
the
smaller
values are
closer
to
the
stem).
A key provides
information
to
interpret both
sides
of
the
plot.
7.
Create a back-to-back
stem-and-Ieaf
plot
comparing
the
lengths of bowhead and gray
whales.
8. Which do you think are typically longer, bowhead or gray
whales? Why do you think so?
Box-and-Whisker
Plots
Another analysis tool is a box-and-whisker
plot,
which plots
five summary numbers based on a data
set,
no matter the
size.
These five summary numbers split the data into
what
are called
quartiles (because they define one-fourth of the data set) and
help compare data sets of different
sizes.
9. Determine the following values:
a.
The smallest length of bowhead whales
_
The smallest length of gray whales
_
These values are referred to as the lower extremes or the
minimum.
b. The largest
length of bowhead whales
_
The largest
length of
gray whales
_
These values are
referred
to as the
upper
extremes
or
the
maximum.
c. The
median length of bowhead
whales
_
The
median length of
gray whales
_
10.
Now,
consider the lengths of
bowhead
whales that are less
than the median length. What is the
median
of these values?
This is called the lower
quartile.
11.
Determine the lower quartile for the length of gray
whales:
12. The upper quartile is determined
by finding the median of all
values
larger
than the median. What is the upper quartile for
the lengths of
bowhead
and gray whales?
_
The five summary numbers on a box-and-whisker
plot are the
five points you have just
determined:
lower
extreme
(minimum),
lower
quartile,
median,
upper
quartile,
and
upper extreme (maxi-
mum).
These values are then plotted along a
scale,
with the
quartiles forming a box, the median as a line
within
the box, and
a line
(or
whisker) reaching from the quartiles to the extremes.
13.
Create
two
box-and-whisker
plots
on
one scale for the
lengths
of
bowhead whales
and
the lengths of gray
whales.
14.
Have you changed
your
opinion about which
type
of
whale is
longer?
Why,
or
why not?
Scatterplots
We can not only compare different whale types but also analyze
different characteristics
within one whale type. When observers
record data during an observation,
they often estimate a whale's
length
and
record the weight based on the whale's type and
shape.
These data can be recorded on a scatter piotto deter-
mine the relationship
between two variables. For a scatter
plot,
the data need to be analyzed to determine the scale for each
axis
and
then plotted based on their individual values.
A
line of
A Typical Box-and-Whisker Plot
25%
of the
25%
of the
data points
25%
of the
25%
of the
data
points
data points
data points
lower
extreme
lower
median
quartile
scale line
upper
quartile
upper
extreme
2
NCTM Student Math
Notes,
May
2008
ADVERTISEMENT
0 votes
Related Articles
Related forms


Related Categories
Parent category: Education