Year 7 Maths Syllabus Outline Page 4
ADVERTISEMENT
 1
1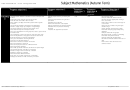 2
2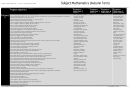 3
3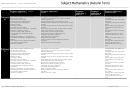 4
4KS3 Assessment – Year 7 Progress Grid
Number
Statistics & Probability
Algebra
Ratio & Proportion
Geometry
Add numbers together in different ways
Find outputs of simple functions
Find information from tables and
N/A
N/A
Round to the nearest 10
Describe simple functions using words or symbols
pictograms
Approximate before adding
Simplify expressions
Find information from bar and bar-
Subtract numbers in different ways
Write expressions given a description in words
line charts
Approximate before subtracting
Substitute positive integers into simple formulae written
Display data using bar and bar-line
Multiply numbers
in words
charts
Recognise numbers
Substitute integers into simple formulae written in letter
Organise data using a tally chart
Recognise square numbers
symbols
Understand and use frequency
Find roots of square numbers on a calculator
Write simple formulae using words and letter symbols
tables
Divide one number by another
Read information from real life graphs
Understand and draw a grouped
Use times tables to help you divide
Draw graphs to show change over time
bar chart
Use approximation to estimate division
Write the co-ordinates of points on a grid
Find the mode of a set of data
calculations
Plot points from their co-ordinates
Find the modal class of a set of
Multiply and divide by 10, 100 and 1000
Plot graphs of simple functions
data
Use addition, subtraction, multiplication and
Read values from graphs
Find the range and median of a
division
Draw line graphs to show relationships between
set of data
Solve simple ratio and proportion problems
quantities
Compare sets of data using their
Use simple negative numbers
Read values from science graphs
range, mode and median
Continue a sequence
Calculate the mean of a set of
data
Add numbers together in different ways
Find outputs of simple functions
Find information from tables and
Round to the nearest 10
Describe simple functions using words or symbols
pictograms
Approximate before adding
Simplify expressions
Find information from bar and bar-
Subtract numbers in different ways
Substitute positive integers into simple formulae written
line charts
Approximate before subtracting
in words
Display data using bar and bar-line
Multiply numbers
Substitute integers into simple formulae written in letter
charts
Recognise numbers
symbols
Organise data using a tally chart
Recognise square numbers
Write simple formulae using words and letter symbols
Understand and use frequency
Find roots of square numbers on a calculator
Read information from real life graphs
tables
Divide one number by another
Draw graphs to show change over time
Understand and draw a grouped
Use times tables to help you divide
Write the co-ordinates of points on a grid
bar chart
Use approximation to estimate division
Plot points from their co-ordinates
Find the mode of a set of data
calculations
Plot graphs of simple functions
Find the modal class of a set of
Multiply and divide by 10, 100 and 1000
Read values from graphs
data
Solve simple ratio and proportion problems
Draw line graphs to show relationships between
Find the range and median of a
Use simple negative numbers
quantities
set of data
Continue a sequence
Read values from a graph
Compare sets of data using their
range, mode and median
Calculate the mean of a set of
data
St Cuthbert's Catholic High School
September 2015
ADVERTISEMENT
0 votes
Related Articles
Related forms

 Worksheet - Grade 4")


Related Categories
Parent category: Education