R Cheat Sheets Page 4
ADVERTISEMENT
 1
1 2
2 3
3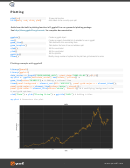 4
4Plotting
plot(ts)
R base plot function
title(main, sub, xlab, ylab)
Adds labels to the currently open plot
Aside from the built in plotting function in R, ggplot2 is a very powerful plotting package.
See
for complete documentation.
ggplot()
Creates a ggplot object
aes()
Creates a properly formatted list of variables for use in ggplot
geom_line()
Plots data with a line connecting them
geom_boxplot()
Plots data in the form of box and whiskers plot
xlab()
Edit the x axis label
ylab()
Edit the y axis label
ggtitle()
Edit the plot title
theme()
Modify a large number of options for the plot from grid elements to colors
Plotting example with ggplot2
library(Quandl)
library(ggplot2)
data_series
<-
Quandl(“GOOG/NASDAQ_AAPL”,
start_date=”2005-01-01”)[,c(1,5)]
my.plot
<- ggplot(data=data_series, aes(x=Date, y=Close)) +
geom_line(color=”#FAB521”) +
# Adding a colored line
theme(panel.background =
element_rect(fill=’#393939’),
panel.grid.major.x =
element_blank(),
panel.grid.major.y =
element_line(colour=’white’, size=0.1),
panel.grid.minor =
element_line(colour=’white’, size=0.1)) +
# modifying background color
# and grid options
xlab(“Date”) +
ylab(“Closing
Price”) + ggtitle(“AAPL”)
# Adding titles
my.plot
# Generates the plot
4
ADVERTISEMENT
0 votes
Related Articles
Related forms


Related Categories
Parent category: Education