Pizza Time Math Worksheet Page 2
ADVERTISEMENT
 1
1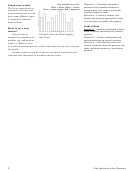 2
2 3
3 4
4Graph your results!
Key (students may color):
Objective 1 – Formulate and answer
Black = olives, Yellow = cheese,
questions using statistical methods to
This is an opportunity to
Green = green peppers, Red = pepperoni
compare data, and propose and justify
introduce or review with
inferences based on data.
your students how to read
Indicator a – Construct, analyze, and
and create different types
display data using an appropriate format
of graphs for different
(e.g. line plots, bar graphs, line graphs).
kinds of data.
Grade 6 Math
Want to go a step
Standard 1 - Students will expand number
further?
sense to include operations with rational
Favorite Topping
Example: Favorite Pizza Topping
Ask the class to
numbers.
Bar Chart
Objective 2 – Explain relationships and
expand the population to
equivalencies among rational numbers.
another city, ask another
Indicator d – Find equivalent forms for
class in a different town,
common fractions, decimals, percents, and
or a class in another state to conduct the same survey and compare
ratios, including repeating or terminating
the results.
decimals.
Another option would be to survey local pizza restaurants and
compare their responses to question number three.
2
Utah Agriculture in the Classroom
ADVERTISEMENT
0 votes
Related Articles
Related forms


Related Categories
Parent category: Education