Financial Report Template Page 48
ADVERTISEMENT
 1
1 2
2 3
3 4
4 5
5 6
6 7
7 8
8 9
9 10
10 11
11 12
12 13
13 14
14 15
15 16
16 17
17 18
18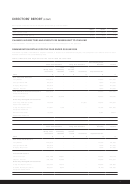 19
19 20
20 21
21 22
22 23
23 24
24 25
25 26
26 27
27 28
28 29
29 30
30 31
31 32
32 33
33 34
34 35
35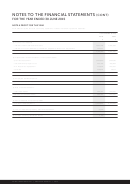 36
36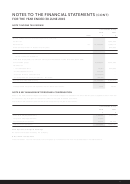 37
37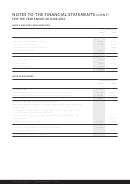 38
38 39
39 40
40 41
41 42
42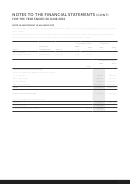 43
43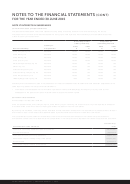 44
44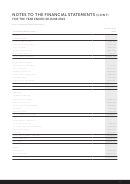 45
45 46
46 47
47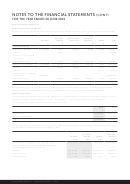 48
48 49
49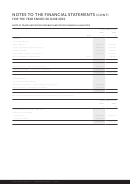 50
50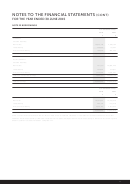 51
51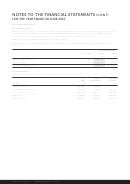 52
52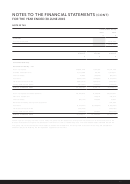 53
53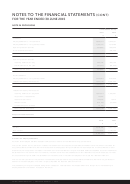 54
54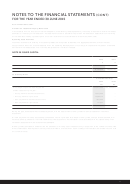 55
55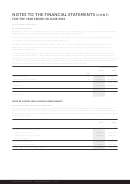 56
56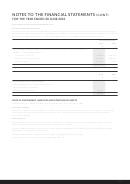 57
57 58
58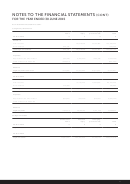 59
59 60
60 61
61 62
62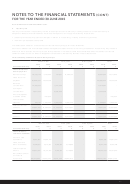 63
63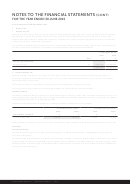 64
64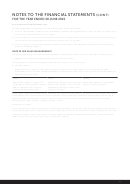 65
65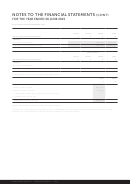 66
66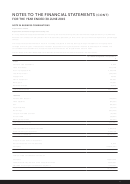 67
67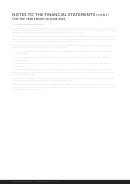 68
68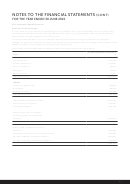 69
69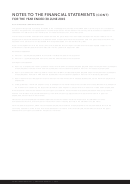 70
70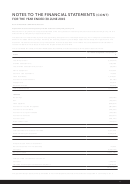 71
71 72
72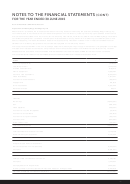 73
73 74
74 75
75 76
76 77
77 78
78 79
79 80
80NOTES TO THE FINANCIAL STATEMENTS
(CONT)
FOR THE YEAR ENDED 30 JUNE 2015
NOTE 19 INTANGIBLE ASSETS CONT.
(a) Movements in Carrying Amounts
Movements in carrying amounts for each class of intangible assets between the beginning and the end of the current financial year.
Erin
Computer
Transformation
Brockovich
Goodwill
software
project costs
agreement
Others
Total
$
$
$
$
$
$
Consolidated Group:
Balance at 1 July 2013
6,797,260
84,276
1,438,824
781,612
44,088
9,146,060
Additions
–
353,189
–
–
–
353,189
Additions through business
combinations
–
–
–
–
–
–
Amortisation charge
–
(27,004)
(405,851)
(113,004)
(11,167)
(557,026)
Balance at 30 June 2014
6,797,260
410,461
1,032,973
668,608
32,921
8,942,223
Additions
–
110,084
850,693
–
196,379
1,157,156
Transfer
–
–
–
–
(32,920)
(32,921)
Acquisitions through business
combinations
30,285,800
–
–
–
–
30,285,800
Amortisation charge
–
(253,759)
(455,261)
(113,004)
(5,146)
(827,170)
Balance at 30 June 2015
37,080,060
266,786
1,428,405
555,604
191,234
39,525,089
Intangible assets, other than goodwill, have finite useful lives. The current amortisation charges for intangible assets are included
under depreciation and amortisation expense per the statement of profit or loss. Goodwill has an indefinite useful life.
Impairment disclosures
For the purposes of impairment testing, the cash generating units have been defined as the lowest level of legal operations to which
the goodwill relates, where individual cash flows can be ascertained for the purposes of discounting future cash flows.
The carrying amount of goodwill allocated to the cash generating unit:
2015
2014
$
$
Personal injury
16,646,052
4,280,010
Emerging practice areas
20,437,008
2,517,250
Total
37,083,060
6,797,260
The recoverable amount of the cash generating units have been determined based on financial budgets set for the next financial year
and management cashflow projections for subsequent years.
2015
2014
Emerging
Emerging
Personal
practice
Personal
practice
Injury
areas
Injury
areas
Pre tax discount rate applied to the cash flow position
12% to 14.7%
12% to 14.7%
13% to 13.5%
13% to 13.5%
Cash flows beyond the next financial year, up to year 5,
are extrapolated using a growth rate of:
Revenue
4.0% to 5.0%
14% to 15%
4.0% to 5.0%
14% to 15%
Operating costs
3.0% to 4.0%
9% to 10%
3.0% to 4.0%
9% to 10%
Terminal growth
3.00%
3.00%
3.00%
3.00%
SHINE CORPORATE LTD | FINANCIAL REPORT | 2015
ADVERTISEMENT
0 votes
Related Articles
Related forms
")


Related Categories
Parent category: Business