Employee Demographics And Employment Data
ADVERTISEMENT
 1
1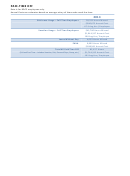 2
22013
| dashBOARD
HUMAN RESOURCES
EMPLOYEE DEMOGRAPHICS and EMPLOYMENT DATA
Most data is as of 1/1 of the applicable year, unless otherwise noted. Some data is prior year results data.
2013
Total Full-Time Employees
4175
Average Age
44.2
Average Annual Salary
44,820
Average Years of Service
13.2 FT / 15.4 PT(BE)
Male/Female Split
55 / 45
Annual Turnover / Rate of Full-Time Employees
2012: 592 | 13.6%
Avg Years of Service of Terminating EEs
2012: 12.5
% of Terminating EEs with <5 years of Service
2012: 176 | 29.8%
% Married
40%
FLSA Non-Exempt Employees (BOCC non-JFS)
231 (70%)
Bargaining Unit Employees
1287
Number of Bargaining Units
12
COMPENSATION DATA
(Source World at Work Salary Survey. Merit Award Market Data: Middle-Performers. Salary Structure Data: Exempt Salaried Data.)
Note: 2012/2013 World at Work Salary Survey data unavailable, therefore not include.
•
2013
COLA Adjustments*
Proj: N/A | N/A | 0.0
(All - Public Sector - Hamilton County)
Merit Increases *
Proj: N/A | N/A | 0.0
(All - Public Sector - Hamilton County
Salary Structure Changes (All/Hamilton County) *
Proj: 1.9 | 0.0
Average Promotional Increase
2012: 12.8% (26)
EMPLOYEE BENEFITS
2013
Total Benefits Eligible
4422
Total Enrolled in Medical Plan
Humana: 3,014 (68%)
MERP: 895 (20%)
Combined: 3,909 (88%)
Total Annual Medical Spend
Humana: $30,915,343
MERP: $4,543,700
Combined: $35,459,043
Annual Cost per Enrolled Employee
Humana: $10,274
MERP: $5,036
Combined: $9,066
Average Age in Medical Plan
44.5 All Plans
44.2 MERP
Average Members Per Family
1.73 All Plans
EE/ER Premium Split (CF1000 Single)
92 / 8 *
Total Benefit Costs as % of Payroll
36.3%
Medical EE Contribution (Single / Family)
36.26 | 139.60
Dental Payroll Contribution – Premium (Single / Family)
13.57 | 38.18
ADVERTISEMENT
0 votes
Related Articles
Related forms


")

Related Categories
Parent category: Business