Mastering Metrics - Dr. Annette M. Parrott Page 2
ADVERTISEMENT
 1
1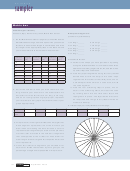 2
2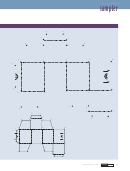 3
3S C I E N C E
sampler
Metric box
Materials (per student)
Scissors, tape, metric ruler, pencil, Metric Box Cutout
What percentage were:
(answers in parentheses)
1. On the Metric Box Cutout on page 55, connect the dots as
indicated below using a ruler and a pencil. As you connect
1 cm long? ______
6 cm long? ______
the dots, measure their length in centimeters and write
2 cm long? ______
7 cm long? ______
the length in the appropriate place in the table. Round
3 cm long? ______
8 cm long? ______
your measurements to the nearest whole number.
4 cm long? ______
9 cm long? ______
5 cm long? ______
Points to
Length
Points to
Length
Points to
Length
5. Assemble the box
connect
(cm)
connect
(cm)
connect
(cm)
A. Remove the shape you have just drawn by cutting
AO
NP
IK
AB
PQ
3C
along the solid black lines. You’ll need to make three
CD
RZ
MO
additional cuts along segments JK, EL, and QZ to free
DE
RS
MN
up some flaps and cube faces.
FG
ST
XY
B. Fold the paper lengthwise along the four parallel
FL
TU
JX
dotted lines to form the body of the cube. Tape
GH
UW
B2
together the two halves of the smiley face, one on
HI
WY
23
a small flap and the other on a cube face, to hold
the cube together.
C. Fold the four remaining flaps in place, two on
2. Count the number of lines you drew that were 1 cm
each of the remaining sides, and seal the cube
long. Record your answers in the table below. Do
by folding down the two final cube faces and
the same for lines that were 2 cm long, 3 cm long,
taping them in place. The tape allows the box to
and so on. Using a piece of graph paper, represent
be reopened and things to be placed inside for
your results as a bar graph. Label both axes of your
studies of density.
graph appropriately.
6. Please tape your completed box to this page.
Length
1 cm
2 cm
3 cm
4 cm
5 cm
6 cm
7 cm
8 cm
9 cm
Number of
lines
3. The pie chart on the right is divided into 24 segments.
Each segment represents one of the 24 lines you
drew when connecting the dots. Choose a color to
represent each length that you drew. On the pie chart,
use that color to shade in the number of segments
that corresponds to the number of lines drawn for
each length. Create a legend that explains what each
color represents.
4. Count the number of segments you shaded in for
each color. Divide that number by 24 to give you the
percentage of segments represented in the pie chart.
s c i e n c e
s c o p e
5 4
S e p t e m b e r 2 0 0 5
ADVERTISEMENT
0 votes
Related Articles
Related forms
 - Preparatory Course First And Second Semester")


")


Related Categories
Parent category: Education