Graphical Summaries For Qualitative Data Bar Graph Worksheets Page 2
ADVERTISEMENT
 1
1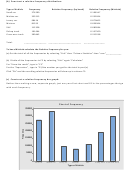 2
2(b) Construct a relative frequency distribution:
Type of Vehicle
Frequency
Relative Frequency (by hand)
Relative Frequency (Minitab)
Small car
276200
0.198147
Midsize car
333515
0.239264
Luxury car
98414
0.070602
Minivan
81355
0.058364
SUV
112328
0.080584
Pickup truck
191664
0.137500
Cross-over truck
300442
0.215538
Total:
_________________ _________________________
________________
To have Minitab calculate the Relative Frequency for you:
(a) Get the total of all the frequencies by selecting “Calc” then “Column Statistics” then “sum”____________
(b) Divide all the frequencies in C2 by selecting “Calc” again “Calculator”
For “Store the result”, type in “C3”
For the “Expression” , type in “C2/the number you got for the total in part (a)
Click “Ok” and the resulting relative frequencies will show up in column C3.
(c) Construct a relative frequency bar graph:
Rather than making a new, separate graph, just use your first chart and fill in the percentages that go
with each frequency.
Chart of Frequency
350000
300000
250000
200000
150000
100000
50000
0
Small car
Midsize car
Luxury car
Minivan
SUV
Pickup truck
Cross-over truck
Type of Vehicle
ADVERTISEMENT
0 votes
Related Articles
Related forms


Related Categories
Parent category: Education