Hearing Level Frequency (Hz)
ADVERTISEMENT
 Printable pdf") 1
1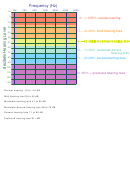 2
2The Audiogram
Frequency (Hz)
125
250
500
1000
2000
4000
8000
-10
0
10
20
30
40
50
60
70
80
90
100
110
120
130
An audiogram is a graph of the quietest sounds a
Frequency
is measured by the number of waves
person can hear.
or cycles that a sound makes in a second. We
use Hertz (Hz) to measure cycles per second
On the audiogram, the test frequencies or pitch
(cps). Another word for frequency is pitch. All
used during hearing testing are shown with the
sounds have a certain pitch or frequency.
vertical
(straight up and down) lines. The decibel
The pitch or frequency of the sounds is measured
(loudness of sounds) levels required for a person's
from left to right (low to high pitch) by numbers at
hearing threshold are shown with the
horizontal
the top of the graph.
lines.
Threshold
means the loudness needed at any
The audiogram shows the hearing loss across a
frequency for a person to just hear the test sound
range of frequencies and is shown in decibels
very softly. The loudness, of the sounds is measured
hearing level (dBHL) or decibels hearing threshold
from soft at the top of the graph to loud at the bottom.
level (dBHTL). Symbols are used to record the
These numbers are along the left and right sides of
test results on the audiogram. Many audiologists
the graph.
use x to show it is the left ear, o the right ear.
Each hearing test center will have a key to the
Decibel
is the scale of loudness of sounds. The
symbols used printed on the audiogram.
higher the decibel, the louder the sound is. For
example 30 dB is a whisper while 100-110 dB is
Audiologists talk about hearing loss according to
how loud a motorbike engine is.
its degree. The audiogram below shows the decibel
Hearing is not measured in percentages %. It is
hearing levels, which match to these degrees of
measured in decibels (dB or dB HL).
hearing loss.
ADVERTISEMENT
0 votes
Related Articles
Related forms


Related Categories
Parent category: Education