Interpreting Z-Scores Page 3
ADVERTISEMENT
 1
1 2
2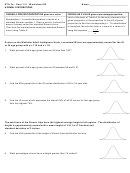 3
3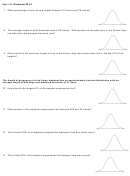 4
4STA 2e: Sect. 3.2 Worksheet #2
Name __________________________
N
D
ORMAL
ISTRIBUTIONS
FINDING A PERCENT/PROPORTION given an x value
FINDING AN X VALUE given a percentage/proportion
Look in the body of Table A for the entry closest to the
Standardize x
t o restate the problem in terms of a
given proportion or the proportion to the left of given
standard Normal variable z.
Draw a picture to show the
proportion to find the corresponding z. “Unstandardize”
area of interest under the standard Normal curve.
to transform the solution from a z-‐score to a value of x
Then find the required area under the standard Normal
µ
−
x
curve using Table A.
=
using the equation
.
z
σ
Scores on the Wechsler Adult Intelligence Scale, a standard IQ test, are approximately normal for the 20
to 34 age group with µ = 110 and σ = 25.
1.
What percent of this age group have an IQ less than 100?
2.
What percent of this age group have an IQ between 90 and115?
3.
Find the 80th percentile of the IQ scores distribution of 20 to 34 year olds.
4.
Find the IQ score which separates the lowest 25% of all IQ scores for this age group
from the highest 75%.
The adult men of the Dinaric Alps have the highest average height of all regions. The distribution of
height is approximately normal with a mean height of 6 ft 1 in (73 inches) and
standard deviation of 3 inches.
5.
Find the 40th percentile of the height of Dinaric Alps distribution for men.
6.
What percentage of men have a height greater than 74 inches?
ADVERTISEMENT
0 votes
Related Articles
Related forms


")
")
")
")


Related Categories
Parent category: Education