'Hawaiian Islands Formation' Geography Worksheet Page 2
ADVERTISEMENT
 1
1 2
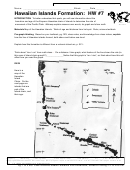
2Island
Km away from hot spot
Age (million years)
Kilauea
0
0
Kauai
519
5.1
Brooks Bank
1256
13
Northampton Bank
1841
26.6
Midway
2432
27.7
Abbott
3280
38.7
Koko
3758
48.1
Suiko Central
4860
64.7
PROCEDURE Use data above to make a line graph with age on the
vertical
axis & distance from the hot spot on the horizon-
tal axis. The range for the
vertical
axis is started for you at 0 and goes up by 5s to 65 (0,5,10, 15....). The range for the
hori-
zontal
axis starts at 0 & rises by 200s to 5200. The slope changes are most noticeable if you place the longer paper dimension
horizontally and use this scale. If using your own graph paper, fit the data to the size of the graph paper. Give a title & units of
each axis. Label each island on the graph. (Extra graph paper is on website ES1 page)
ANALYSIS
1. Look at the graph. The slope of the line tells you the rate (or speed) of the plate movement. Based on your graph,
has the rate of movement been constant through time?____ Explain your answer.
2. Calculate the rate of plate movement between two island pairs based on the data. Why would you round to 1 deci-
mal place only? (Check Density and Measurement Notes if needed)_____________________________
Show your work for each. Use this formula:
distance from island 1 - distance from island 2
age of island 1 - age of island 2
example:
Suiko to Koko
4860 km - 3758 km =
______________ (give unit)
64.7 my - 48.1 my
Koko to Abbot
______ km - _______ km =
______________ (give unit)
my -
my
Abbot to Midway (show work)
Midway to Brooks Bank
Brooks Bank to Kauai
Kauai to Kilauea
3. Based on your calculations, describe how the rate of movement changes over time:
Label on the map the two areas where the speed of movement is fastest and slowest and 2 areas of steady speed.
Done____ How do you think that speed and acceleration differ? Look it up if needed.
Label the areas of fastest and slowest acceleration on your map. Done__
4 Look at the map of the island chain. Between which islands is there a bend in the chain?_________________
&_____________________________ Label this on the map. Done____
During what range of years did this occur?______________________
Look at the islands’ ages. Use this to describe how the direction the line of islands must have moved before and after
the bend in the
chain.
Before:_________________________After the bend:________________________
Think how Hawaii formed. Hypothesize how plate movement might have changed to cause the bend in the island
chain:
5. Compare the rate of movement to the direction of movement: Does there seem to be a connection?___ Explain
why or why not.
Write a question that a geologist might explore because of this:
Pg.
2
of
2
ES1 Plate Tectonics Hawaii Formation from Richardson; Sanders-Fleming 4/1/16 4:08 PM
ADVERTISEMENT
0 votes
Related Articles
Related forms


Related Categories
Parent category: Education