Ap Microeconomics Formula Chart
ADVERTISEMENT
 1
1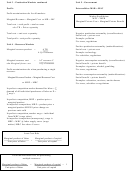 2
2Formula Chart – AP Microeconomics
Unit 2 – Supply and Demand
Unit 3 – Production Markets
Total Revenue = price x quantity
Revenue:
Total Revenue = price x quantity
Total revenue test
TR
P
and TR
then demand elastic
Average Revenue =
Q output
P
and TR
then demand inelastic
P
and TR
then demand elastic
P
and TR
then demand inelastic
∆TR
Marginal Revenue =
∆ Q output
Coefficient of price elasticity of demand:
TR @ maximum when MR goes negative
% ∆ quantity demanded
% ∆ price
In perfect competition, MR = price (demand)
for individual sellers
Coefficient > 1 = elastic demand
In perfect competition, individual seller
Coefficient < 1 = inelastic demand
price = market price (price taker)
Coefficient = 1 = unit elastic demand
In imperfect competition, MR < price (Demand)
Coefficient = ∞ = perfectly elastic demand
In imperfect competition, individual seller IS
Coefficient = 0 = perfectly inelastic demand
THE MARKET (price maker)
Cross elasticity of demand: comparing 2 items:
Cost:
st
% ∆ quantity of 1
item
nd
% ∆ price of 2
item
Total Cost = Total fixed cost + Total average cost
Cross elasticity coefficient positive = items
Total Cost = unit cost x quantity output
substitute for each other
Cross elasticity coefficient negative = items
Average fixed cost =
TFC
complement each other
Q output
Income elasticity of demand: % ∆ quantity
Average variable cost =
TVC
% ∆ income
Q output
Income elasticity coefficient positive = normal
Average total cost =
TC
good
Q output
Income elasticity coefficient negative = inferior
good
Average total cost = AFC + AVC
Supply elasticity: % ∆ quantity supplied
Marginal cost =
∆ TC
% ∆ price
∆ Q output
Tax Revenue = (Price w/tax – price seller
Product (aka output):
receives) x Quantity
Average product =
Total product
Q input
Marginal product =
∆ TP
Utility maximization rule
∆ Q input
Marginal Utility of Good A
Marginal Utility of Good B
=
TP @ maximum when MP goes negative
Unit cost of A
Unit cost of B
In perfect competition market supply = ∑ individual
seller cost curves or S = ∑ mc’s
ADVERTISEMENT
0 votes
Related Articles
Related forms


")


Related Categories
Parent category: Education