Binomial Simulation Page 4
ADVERTISEMENT
 1
1 2
2 3
3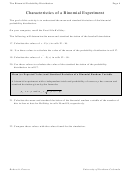 4
4The Binomial Probability Distribution
Page 4
Characteristics of a Binomial Experiment
The goal of this activity is to understand the mean and standard deviation of the binomial
probability distribution.
On your computer, recall the Excel file Holliday.
The following will determine the mean and standard deviation of the baseball simulation.
x ⋅
17. Calculate the values of
P
(x
)
in cells I2 – I6.
18. Use these values to calculate the value of the mean of the probability distribution in cell I7.
x ⋅
2
19. Calculate the values of
P
(
x
)
in cells J2 – J6.
20. Use these values to calculate the value of the standard deviation of the probability
distribution in cell J7.
Mean (or Expected Value) and Standard Deviation of a Binomial Random Variable
A binomial experiment with n independent trials and probability of success p has a mean and
standard deviation given by the formulas
µ
σ
=
⋅
=
⋅
⋅
−
n
p
and
n
p
1 ( p
)
X
X
21. Calculate the mean and standard deviation of the binomial random variable of the number of
hits in four at bats for Holliday in cells I8 and J8, respectively.
22. Compare these values with the values found for the simulation.
Robert A. Powers
University of Northern Colorado
ADVERTISEMENT
0 votes
Related Articles
Related forms


Related Categories
Parent category: Education