Human Population Growth Worksheet Template
ADVERTISEMENT
 1
1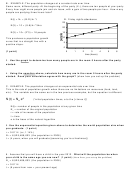 2
2 3
3 4
4Human Population Growth
Name:
Introduction: Darwin’s first two observations in the exposition of Natural Selection involve
population ecology: Populations have the potential to increase exponentially, but usually they
remain constant in size. Both conditions are observed in nature and are associated with the
balance of (births + immigrations) minus (deaths + emigrations).
Key Concepts:
•
Population growth patterns
•
Factors influencing population growth
What’s due at the end of workshop next week:
•
This worksheet and graph with all of the questions answered 10 points
HOW DOES A POPULATION CHANGE?
Population size depends on how many (births + immigrations) minus (deaths + emigrations)
there are. Let’s look at four ways a population can grow.
For the following examples,
N = number of people in the population at any given time
N
= number of the original population
o
B = births (number of people joining the population)
D = deaths (number of people leaving the population)
t = time
A. EXAMPLE: The population remains constant over time (EQUILIBRIUM).
Imagine you are having a party in your living area. At the present time (N
), there are ten
o
people in your room. Every hour one person leaves and one person joins your party. How many
people are in your room three hours after the party started?
A. People in your room.
N(t) = N
+ (B-D)/hr *t
o
12
N(3) = 10 + (1-1)/hr *3hrs
10
8
N(3) = 10 people
6
4
This produces a population growth
curve that is a straight line with no
2
slope.
0
0
1
2
3
4
5
6
(1 point)
time (hours)
1. Use graph A. above to determine
how many people are in the room 5 hours after the party started.
2. Using the equation above, calculate how many are in the room 6 hours after the party
started. Does your calculation agree with the graph?
ADVERTISEMENT
0 votes
Related Articles
Related forms


Related Categories
Parent category: Life