Reading And Drawing Simple Graphs Worksheet
ADVERTISEMENT
 1
1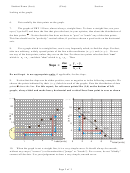 2
2 3
3Student Name (Last)
(First)
Section
BOROUGH OF MANHATTAN COMMUNITY COLLEGE
SCIENCE DEPARTMENT. GENERAL PHYSICS (PHY 110)
Laboratory Experiment 2
A rewrite of the experiment in the manual. All data is the same, just more needed explanations.
READING AND DRAWING SIMPLE GRAPHS
Partners names
OBJECTIVES
To familiarize the students with reading, interpreting and drawing simple graphs.
APPARATUS
Graph paper, pen/pencil, straightedge/ruler, protractor (optional), calculator.
INTRODUCTION
There are many reasons for drawing graphs in the natural and social sciences. One of them is being
able to present experimental results in a way which can be easily, clearly and quickly understood by
ourselves and others. A graph should allow someone to interpret the measured data correctly and
easily. Graphs, quite often, allow someone to recognize relations, and perform interpolations and
extrapolations of these relations between the variables represented. In Physics, graphs are used very
extensively in order to compare theoretical predictions with experimental data. Graphs are also used
in order to find an "average" among the measurements, thus improving the accuracy of the set of
data collectively versus each individual measurement.
GRAPHING INSTRUCTIONS
When drawing graphs there are several things that one must have in mind:
1.
The graph should occupy most of the available space. For the purposes of PHY 110, this
means that the graph should occupy at the very least 60% of the graph paper page, unless your
Instructor explicitly tells you otherwise.
2.
Draw two axes that are perpendicular to each other. In a graph A versus B, quantity A
(dependent variable) should be represented on the vertical axis, and quantity B (independent
variable) should be represented on the horizontal axis.
3.
Choose the numerical scales on each of the two axes independently, so as to satisfy point 1.
−
−
−
y - y
y - y
(15 4) (
units
)
11
units
(4 12) (
units
)
8
units
=
=
=
=
=
= −
2
1
2
1
Slope =
Slope =
3.67
units
2
units
−
−
x - x
x - x
(4 1)
(
units
)
3
units
(6 2)
(
units
)
4
units
2
1
2
1
above. The two axes do not have to intersect at their corresponding origins.
4.
Label each axis with the physical quantity it represents and the units in which each quantity
is measured.
5.
Label, with units, the graph so that it is self-contained. A reader unfamiliar with the
experiment should be able to get a good idea about the results of the experiment (data) by just
Page 1 of 3
ADVERTISEMENT
0 votes
Related Articles
Related forms


Related Categories
Parent category: Education